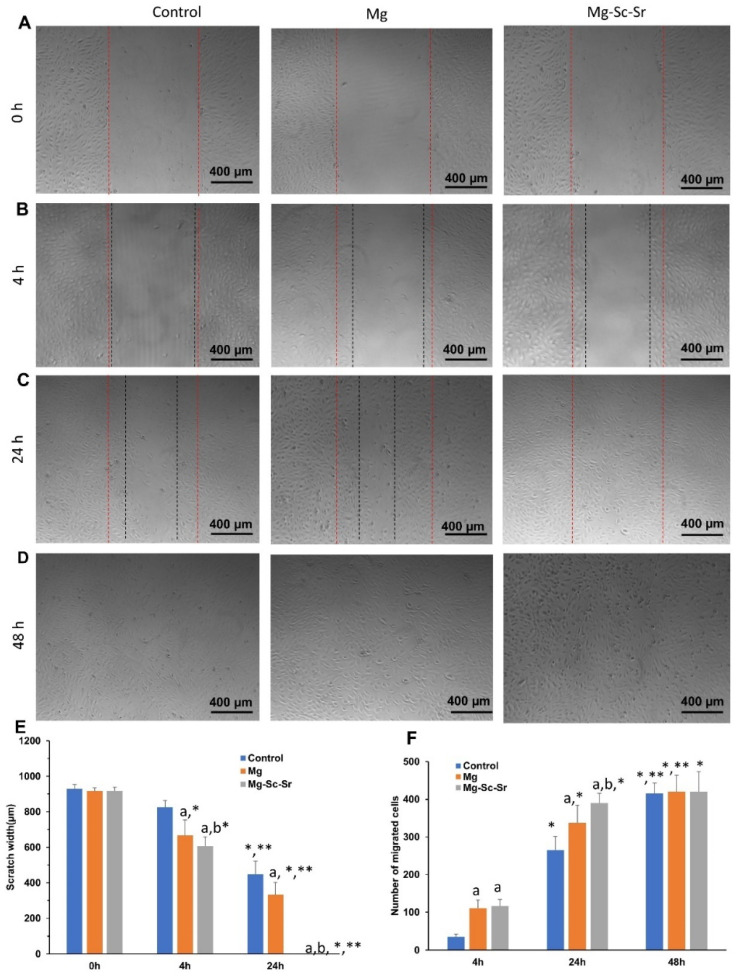
Figure 6.
Scratch assay of HUVECs cultured with the control, Mg, and Mg-Sc-Sr extractions in vitro. (A) Images of initial wound scratch. Representative migration images of HUVECs after culturing with the control group, Mg extract, and Mg-Sc-Sr extract after (B) 4 h, (C) 24 h, (D) 48 h, (E) quantification of scratch width, (F) Quantification of the number of migrated cells. The width between red dots shows the primary scratch and the width between black dots shows the scratch width after incubation with or without extracts. Significant differences based on two-way ANOVA: a: p < 0.05 Mg and Mg-Sc-Sr vs. control, b: p < 0.05 Mg-Sc-Sr vs. Mg. For scratch width: *: p < 0.05 4 h and 24 h vs. 0 h, **: p < 0.05 24 h vs. 4 h for each experimental group. For the number of migrated cells: *: p < 0.05 24 h and 48 h vs. 4 h, **: p < 0.05 48 h vs. 24 h for each experimental group.

