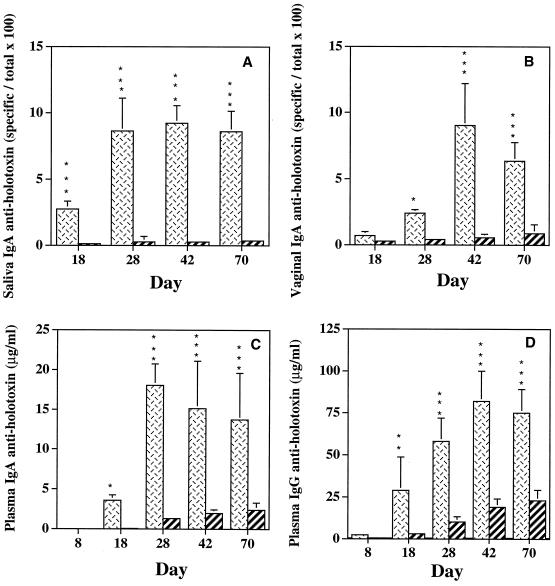
FIG. 4.
Salivary IgA (A), vaginal IgA (B), plasma IgA (C), and plasma IgG (D) responses to CT or LT-IIa in mice immunized by the i.n. route with SBR-CTA2/B (cross-hatched bars) or SBR–LT-IIaA2/B (striped bars), respectively. Data represent the arithmetic means + standard deviations (error bars) of eight mice per group. ∗ and ∗∗∗, statistical significance at P < 0.05 and P < 0.001, respectively.

