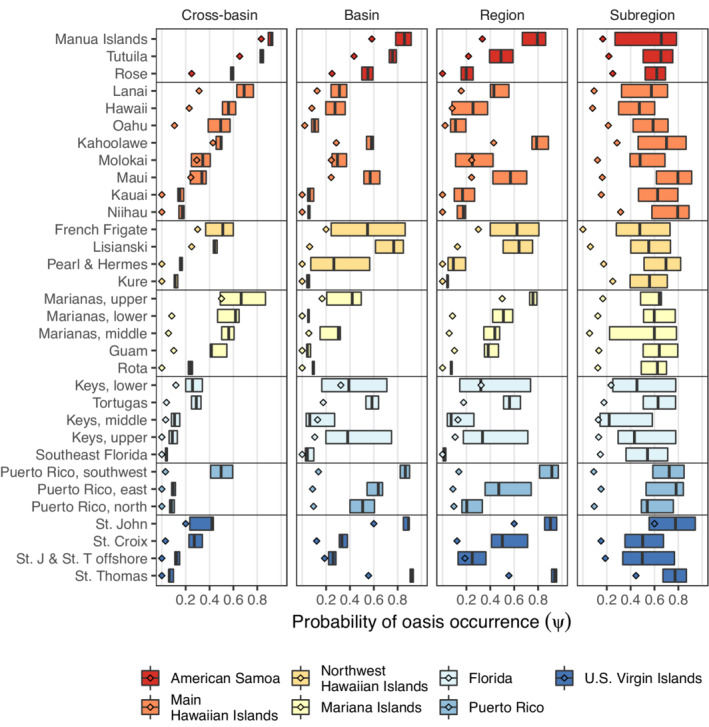
FIGURE 4.

The probability of oasis occurrence () within each subregion and by spatial extent. Boxplots indicate the median and quartiles of posterior median probability of oasis occurrence for grid cells within each subregion. Diamonds indicate the observed proportion of grid cells with an oasis (i.e., naïve oasis occurrence).
