FIGURE 5.

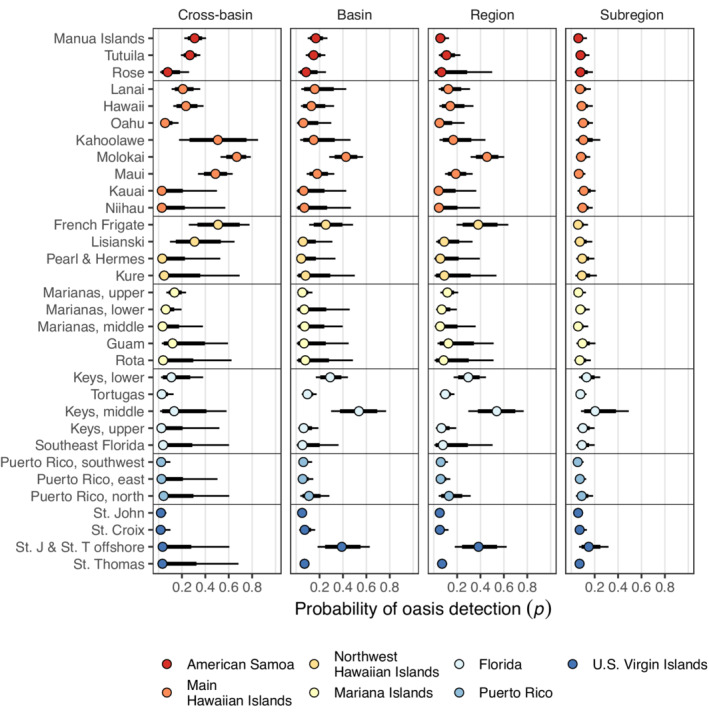
The probability of detecting an oasis (p) for each subregion and by spatial extent. Probabilities are Bayesian posterior median values with 95% and 80% credible intervals (thin and thick lines, respectively).

The probability of detecting an oasis (p) for each subregion and by spatial extent. Probabilities are Bayesian posterior median values with 95% and 80% credible intervals (thin and thick lines, respectively).