FIGURE 6.

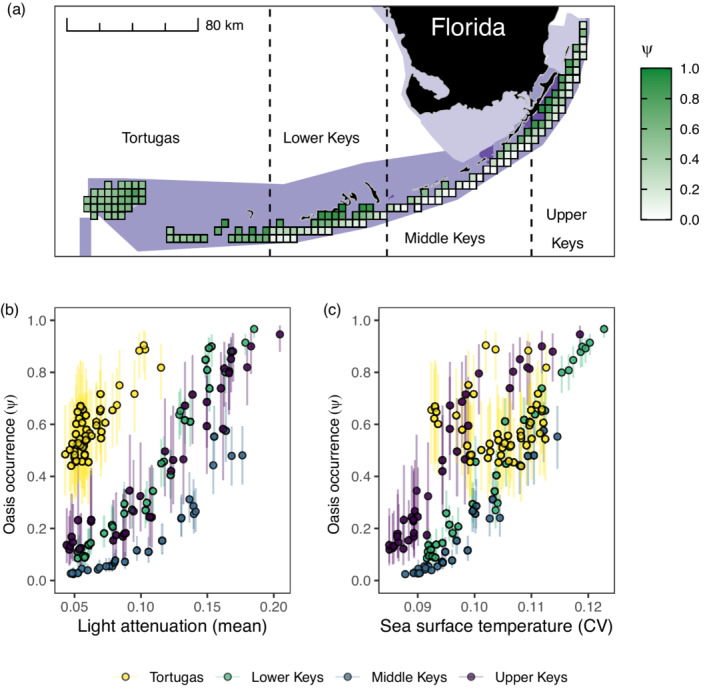
The median probability of oasis occurrence () in grid cells of four subregions (Tortugas, Lower Keys, Middle Keys, Upper Keys) in Florida, USA, plotted geographically (a) and as a function of mean light attenuation (Kd490, m−1; b) and the coefficient of variation (CV) in monthly sea surface temperature (SST in °C; c). Oases were defined at the regional spatial extent, i.e., across the five subregions in Florida (the southeast Florida subregion was not included in the map for figure clarity). In (a), grid cells represent 21.2 km2 areas that were surveyed for coral cover at least once. Light, medium, and dark purple polygons represent areas within United States National Parks, the Florida Keys National Marine Sanctuary, and Florida State Parks, respectively. In (b) and (c), error bars are 50% credible intervals.
