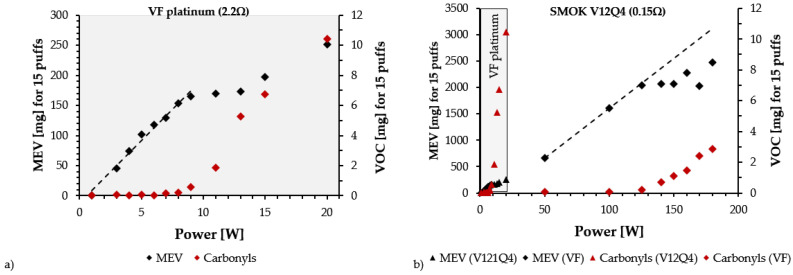
Figure 1.
Both panels display vaporized e-liquid mass (MEV) in mg vs. supplied power in W (black squares), with data taken from the experimental results listed in the supplementary file of Talih et al. [22]. Both panels show how in a laboratory setting it is possible to detect the power ranges where the MEV vs. W relation is linear and the appearance of overheating conditions when it becomes nonlinear, coinciding with the onset of an exponential increase of aldehyde production (red squares). The left panel (a) shows how for a low-powered device, the optimal regime occupies a narrow power range, while for a high-powered device (right panel (b)), the power range is wide. Notice that the power range of the optimal regime of the low-powered device is compressed in the extreme left-hand side of the graph of panel (b)).

