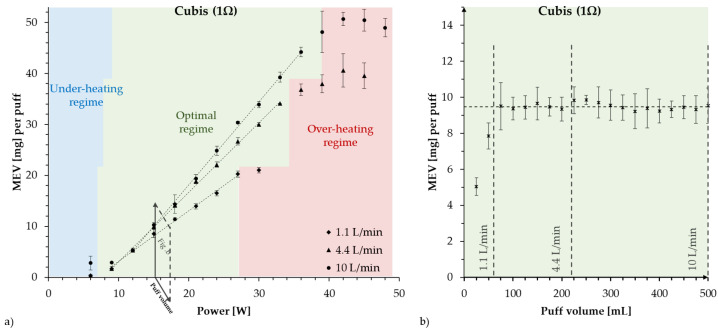
Figure 2.
Comparison of two functionality curves for the Cubis 1 device: MEV vs. W for fixed airflow (left panel (a)) and MEV vs. puff volume in mL for fixed power at 15 W (right panel (b)). Panel (a) displays the effects of increasing the fixed airflow from 1.1 L/min (CORESTA conditions), 4.4 L/min to 10 L/min (extracted from [8]). A higher airflow rate increases the slope of the linear relation between MEV and W, allowing for a wider power range under the optimal regime, with appearance of overheating conditions at higher power settings. For low airflow (smaller slope), the optimal regime is limited by a narrow power range. The right panel (b) shows MEV to be insensitive to increasing puff volume, apparently suggesting that airflow has no effect on MEV. However, varying airflow under a single fixed power is an artificial testing combination that does not define the optimal regime (see explanation in the text).

