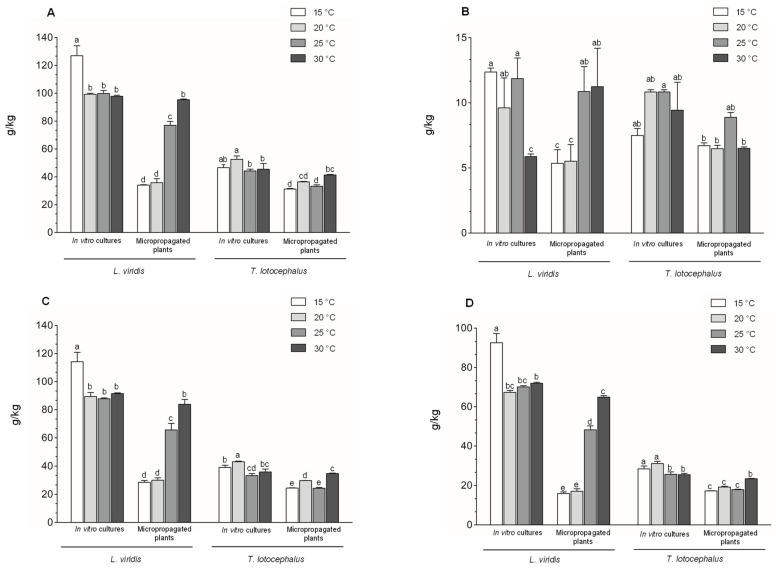
Figure 3.
Effect of exposure to different temperatures (15, 20, 25, and 30 °C) on (A) total phenolic content, (B) total flavonoid content, (C) total phenolic acids content, and (D) total rosmarinic acid content determined by HPLC-HRMS of in vitro cultures and micropropagated plants of Lavandula viridis and Thymus lotocephalus. For each species, the results were analyzed by one-way analysis of variance (ANOVA) and the graph bars followed by different letters (a–e) are significantly different at p < 0.05 (Duncan’s New Multiple Range Test).

