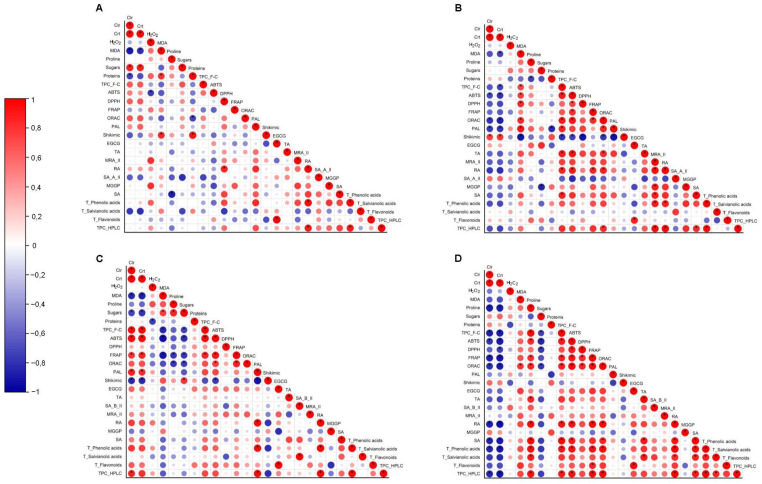
Figure 5.
Heat map corresponding to the Pearson’s correlation coefficients (circles) between the contents photosynthetic pigments (chlorophylls and carotenoids), oxidative stress indicators (H2O2 and MDA), osmoprotectants (proline, soluble sugars, soluble proteins), shikimic/phenylpropanoid intermediates (PAL activity, shikimic acid content), total phenolic content (F-C and HPLC), total phenolic acids content (HPLC), total salvianolic acids content (HPLC), total flavonoids content (HPLC), and the most abundant individual phenolic compounds (HPLC), namely epigallocatechin gallate (EGCG), theaflavic acid (TA), salvianolic acid B isomer II (SA_B_II), methylrosmarinic acid isomer II (MRA_II), rosmarinic acid (RA), salvianolic acid A isomer II (SA_A_II), methyl 6-O-galloyl-β-D-glucopyranoside (MGGP), and sagerinic acid (SA) and antioxidant activity (DPPH, ABTS, FRAP, ORAC) from T. lotocephalus (A) in vitro cultures; (B) micropropagated plants; L. viridis (C) in vitro cultures; (D) and micropropagated plants. * Correlation is significant (p ≤ 0.01).

