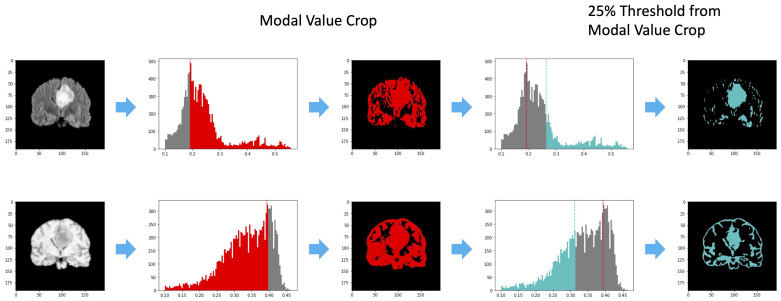
Figure 3.
An illustrative example of the threshold operations performed during the KBF procedure on FLAIR and T1w slices (first image), reported in the first and second rows respectively. The red filter (second image) considers the mode value, while the third image represents the output of the first filtering process. On the other hand, the light-blue filter (fourth image) exploits the 25% of the highest and the 25% of the lowest values in the FLAIR and T1-w acquisition, respectively. The output of the KBF procedure is shown in the fifth image.

