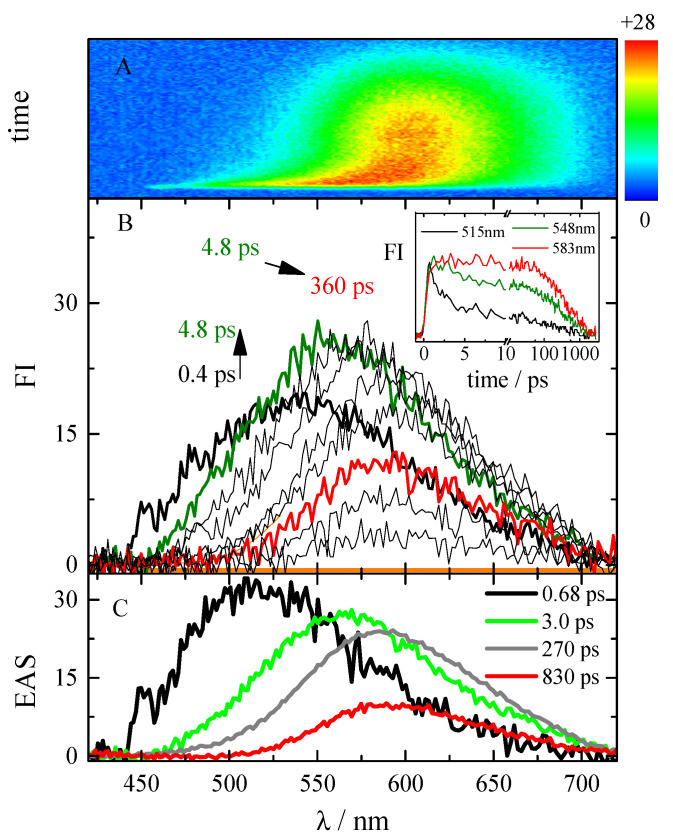
Figure 7.
Femtosecond fluorescence up-conversion measurements (λexc = 400 nm) of compound DMA-QF in DMF. Panel (A): experimental 3D matrix reporting color-coded fluorescence intensity (FI) as a function of wavelength and time; Panel (B): representative emission spectra at different delay times and representative kinetics (inset) at different wavelengths together with steady-state emission (orange-shaded area); Panel (C): EAS (excited associated spectra) obtained by global analysis.

