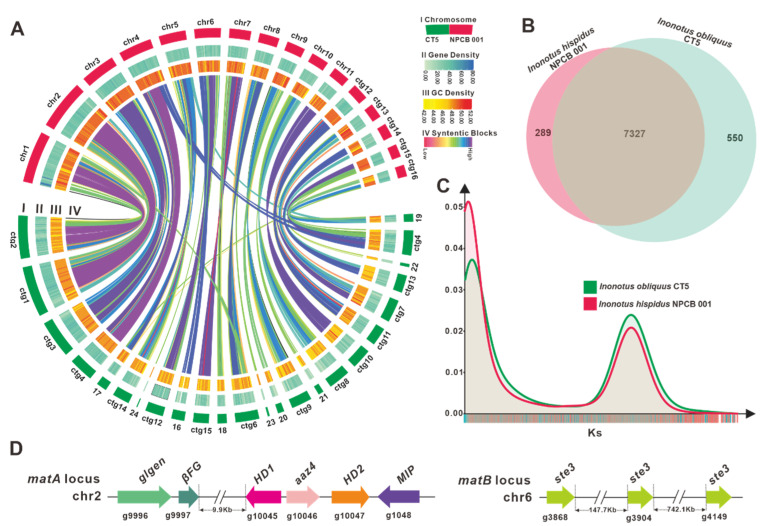
Figure 2.
Genomic characterization, mating type loci, and comparative genomic analysis. (A) Genomic collinearity analysis between I. hispidus NPCB_001 and I. obliquus CT5. From the outside to the inside are I. Chromosome and Contigs; II&III. Gene density and GC density: the intensity of the color positively correlates with gene density; Ⅳ. Whole-genome collinearity analysis based on protein-coding genes: sequence similarity from low to high is indicated by red to purple. (B) Venn schematic of comparative genomes within Inonotus species. (C) Ks comparison within Inonotus species. (D) Structural diagram of the genes on the matA locus and matB locus of I. obliquus.

