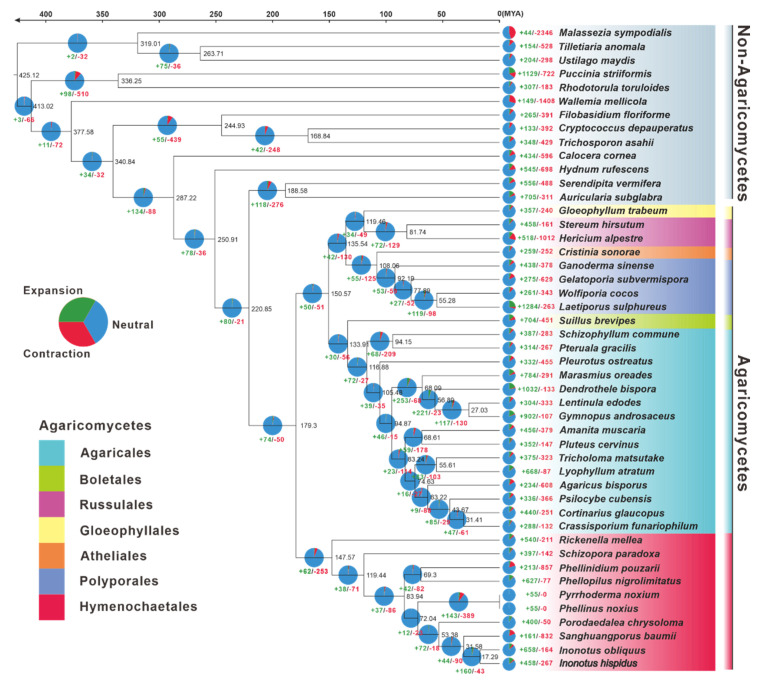
Figure 3.
The evolutionary relationship and expanded and contracted gene families among Inonotus species and 45 representative Basidiomycetes. The maximum likelihood method credibility tree was inferred from 47 single-copy orthologous genes. All nodes received full bootstrap support. The divergence time is labeled as the mean crown age for each node, while the 95% highest posterior density is also given within the Inonotus clade. The black numbers at the branches indicate the corresponding divergence times in millions of years (MYA). The numbers of gene family expansion and contraction in each species are labeled with green and red symbols, respectively. The proportion of expansion and contraction in the genome of each species was displayed before its species name. The background color of each species of Agaricus indicates its corresponding order.

