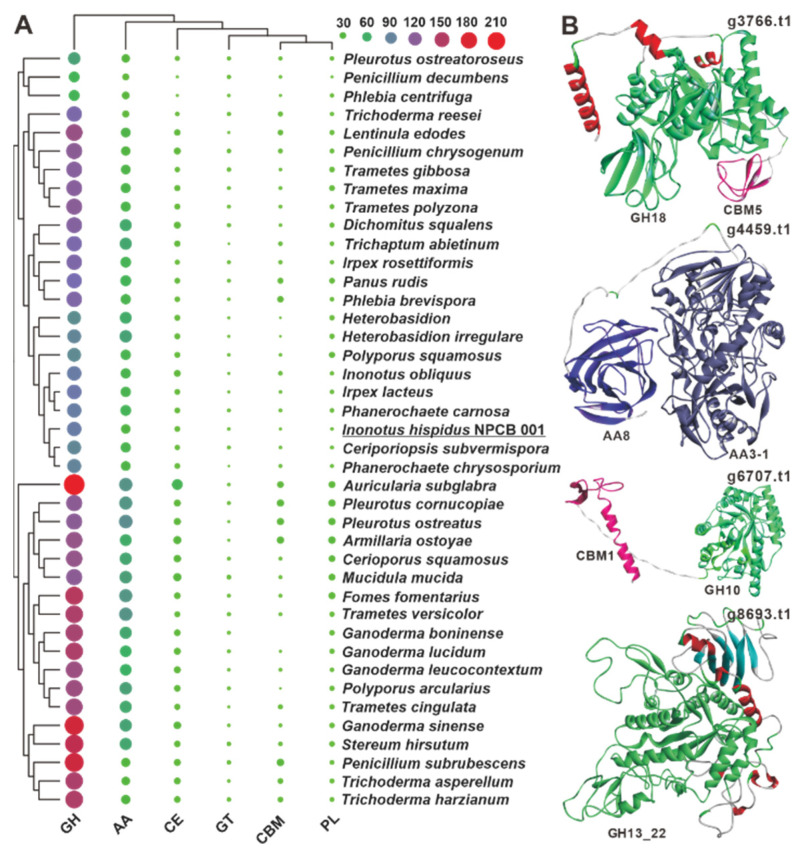
Figure 4.
CAZymes analysis of I. hispidus and related white-rot fungi. (A) The sizes and colors (from green through purple to red) of circles in the bubble plot indicate the change in quantity, and the different colored triangles indicate different families. (B) The predicted structures of four bifunctional domain-containing CAZymes.

