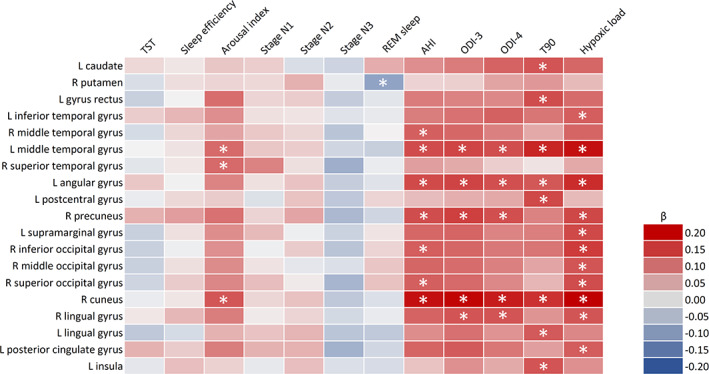
FIGURE 1.

Heatmap of the significant associations between R2* and sleep variables. Data were analysed by linear regression using R2* as the dependent variable and individual sleep variables as independent variables. Models are adjusted for age, time between polysomnography and MRI, sex, body mass index, diabetes, dyslipidaemia, hypertension, smoking, and continuous positive airway pressure treatment. Asterisks indicate p <0.005. AHI, apnea‐hypopnea index; L, left; ODI, oxygen desaturation index; R, right; T90, percentage of sleep time with oxygen saturation <90%; TST, total sleep time; β, standardised beta coefficient
