
FIGURE 2.
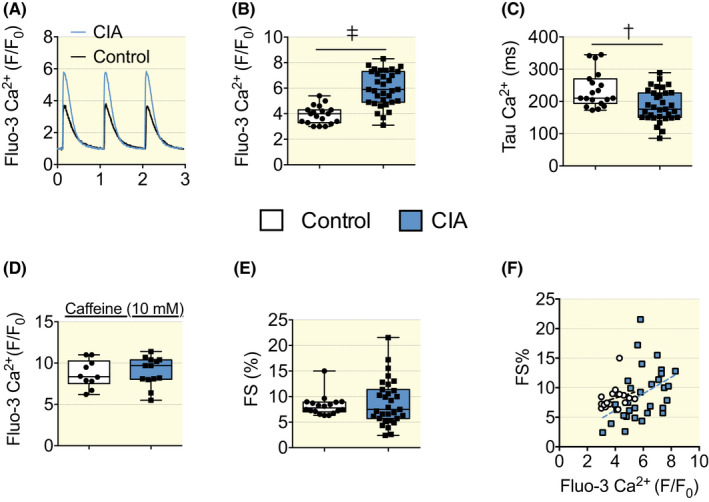
[Ca2+]i and fractional shortening measured in isolated cardiomyocytes, Fluo‐3 AM was used to measure [Ca2+]i transients in cardiomyocytes that were electrically paced (1 Hz) to elicit repeated contractions. Representative [Ca2+]i transient records (A). Mean data of [Ca2+]i transient amplitudes (B), Tau, [Ca2+]i decay time‐constant (C). Caffeine (10 mM) was used to trigger the opening of the RyR2 and cause the maximum release of SR Ca2+ (D). Fractional shortening (E) of cardiomyocytes stimulated at 1 Hz under control conditions (n = 19–33). (F) XY graph of Ca2+ fluorescence on the X axis and contractility (FS%) on the Y axis for each cardiomyocyte. Cardiomyocytes of the CIA group showed higher Ca2+ transients as they distributed on the right part of the graph and right shifting of the linear regression curve of the CIA group. Control r 2 0.069, p = 0.29, slope 0.731 ± 0.7, CIA r 2 0.183, p < 0.05, slope 0.139 ± 0.5. Data are presented as box and whiskers min and max including all points. *p < 0.05, †p < 0.01, ‡p < 0.001 with unpaired t test.