
FIGURE 3.
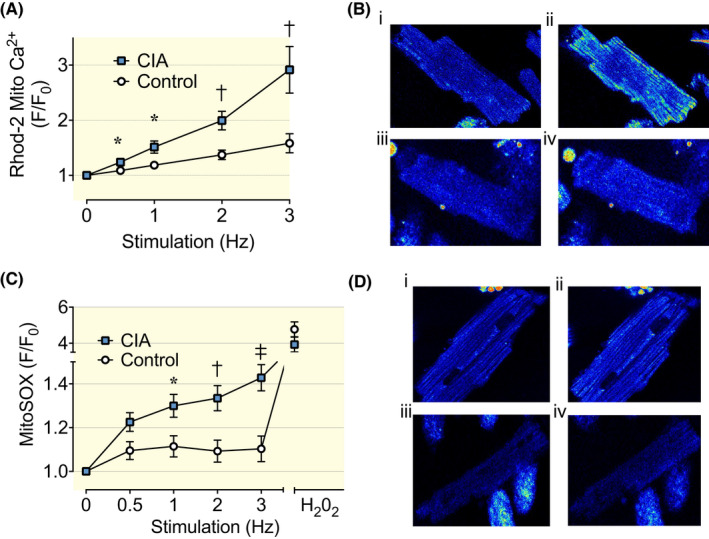
Mitochondrial Ca2+ uptake and ROS production in cardiomyocytes from CIA and control mice. (A) Mean (±SEM) of mitochondrial Ca2+ in cardiomyocytes electrically paced at 0.5–3 Hz by brief current pulses, n = 21–30. Rhod‐2 fluorescence is normalized to the resting value in each cardiomyocyte. (B) Representative images of Rhod‐2 fluorescence in CIA (i and ii) and control (iii and iv) cardiomyocytes at the end of 0.5 Hz (i and iii) and 3 Hz (ii and iv) pacing. (C) Mitochondrial ROS in cardiomyocytes was measured as MitoSOX Red fluorescence (mean data ± SEM, n = 12–22) at 0.5–3 Hz electrical stimulation. Hydrogen peroxide (H2O2; 1 μM) was used as a positive control at the end of the experiment. (D) Representative images of MitoSOX Red fluorescence in CIA (i and ii) and control (iii and iv) cardiomyocytes at the end of 0.5 Hz (i and iii) and 3 Hz (ii and iv) pacing. Data are presented as mean ± SEM. *p < 0.05, †p < 0.01, ‡p < 0.001 with Mann–Whitney non‐parametric test.