
FIGURE 5.
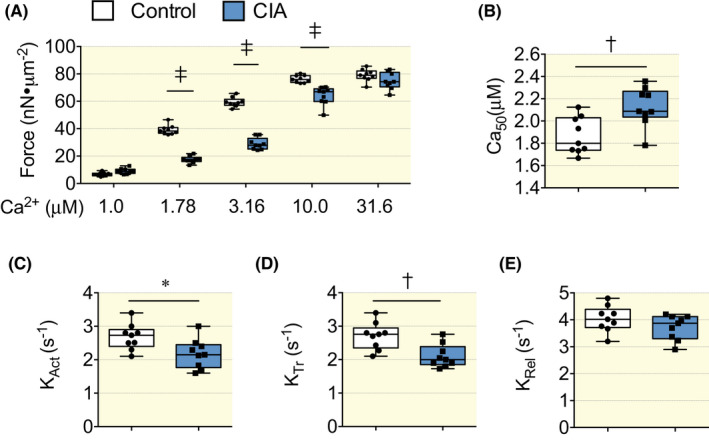
Reduced Ca2+ sensitivity in myofibrils isolated from CIA hearts. (A) The submaximal Ca2+ activated force was lower in isolated myofibrils from CIA hearts than in controls, whereas maximal Ca2+ activated force was not different between the groups. (B) The [Ca2+] needed to achieve 50% of maximal myofibrillar force (Ca50) was significantly increased in the CIA group, showing that myofibrillar Ca2+ sensitivity was lower in the CIA hearts. (C,D) The rates of force development at the onset of maximum contractions (KAct) and redevelopment after a shortening step (KTr) were both reduced in CIA than in control myofibrils. (E) The rate of relaxation following deactivation (KRel) did not differ between CIA and control myofibrils. Average data in (A–E) is displayed as box and whiskers min and max including all points., n = 9. *p < 0.05, †p < 0.01, ‡p < 0.001, repeated measurements anova (A), t test (B–E).