
FIGURE 6.
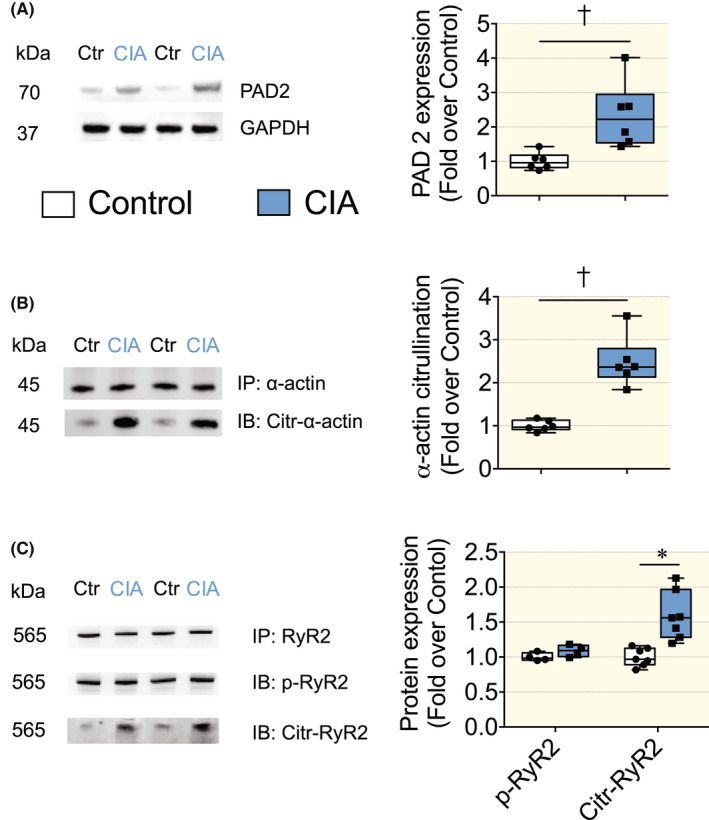
Expression of PAD2 and post‐translational modification of α‐Actin and RyR2 in hearts of CIA and control mice. (A) (left) Expression of PAD2 in hearts of CIA and control mice; (right) mean band densities normalized to GAPDH and the mean value in control hearts set to 1.0 (n = 6). (B) (left) Representative immunoblots from immunoprecipitated α‐Actin; (right) mean citrulline band densities normalized to total α‐Actin and the mean value in control hearts set to 1.0 (n = 6). (C) (left) Representative immunoblots from immunoprecipitated RyR2; (right) mean phosphorylated (p‐RyR2; PKA phosphorylation site RyR2‐S2808) and citrullinated RyR2 bands densities normalized to total RyR2 and the mean value in control hearts set to 1.0 (n = 7). Data are presented as box and whiskers min and max including all points. *p < 0.05, †p < 0.01, ‡p < 0.001 with Mann–Whitney non‐parametric test.