
FIGURE 7.
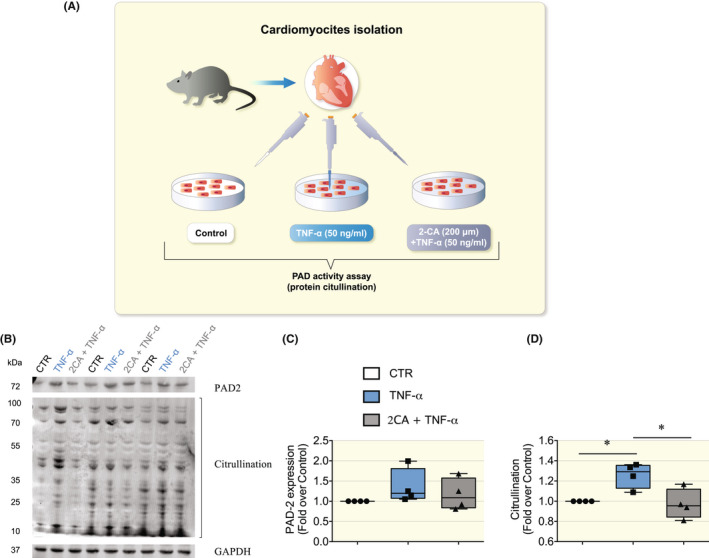
TNF‐α triggered PAD‐dependent citrullination in cardiomyocytes. (A) Cartoon depicting the in vitro model to mimic the inflammatory phase of RA. We used cardiomyocytes isolated from DBA mice (N = 4 mice) treated for 20 h with TNF‐α (50 ng/ml), pretreated with or without 2‐chloroacetamidine (2‐CA, 200 μM) a small molecule that inhibits PADs active‐sites. Then, PAD‐dependent citrullination was measured and normalized to baseline levels (e.g. cells untreated, CTR). (B) Representative immunoblots from cardiomyocytes lysates blotted for PAD2, citrullination, and GAPDH. (C) Mean band density of PAD2 normalized to GAPDH. (D) The mean band density of protein citrullination normalized to GAPDH, which appeared to be significantly increased in cardiomyocytes treated with TNF‐α. Data are presented as box and whiskers min and max including all points. *p < 0.05, †p < 0.01, ‡p < 0.001 with one‐way anova test, multiple comparisons.