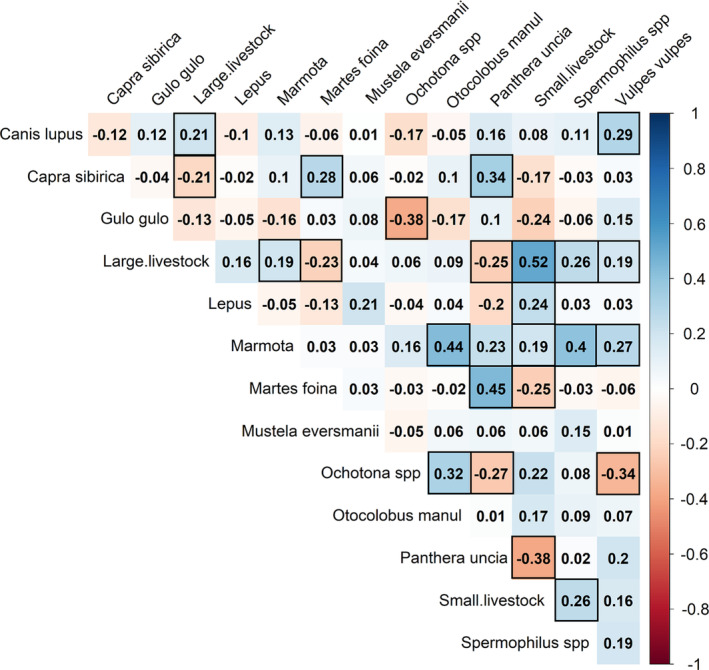
FIGURE 2.

Matrix of all interspecific correlation coefficients (c) in occupancy for wild and domestic mammals detected by camera traps at 216 sites in Mongolian Altai Mountains. Positive correlations are highlighted in blue, negative correlations in red. Species are listed in alphabetical order. Values with a black border are correlation coefficients whose 90% CI did not overlap zero.
