
Figure 8.
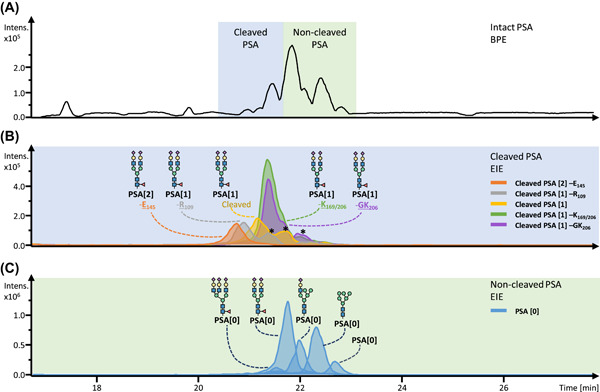
Intact analysis using CE‐ESI‐MS of PSA captured from a patient pool. (A) BPE of intact urinary PSA. (B) EIEs reveal various PSA proteoforms with and without internal cleavages. The proteoforms are illustrated with their most abundant glycan. The square brackets indicated the number of internal cleavages, followed by a potential loss of amino acid(s). (C) EIEs of the most abundant glycan structures (tri‐, di‐, mono‐sialylated and high mannose type) as well as the nonglycosylated proteoforms without an internal cleavage. Overlapping m/z values are indicated with an *. Figure adapted with permission from (Moran et al., 2021). Copyright © 1969, Elsevier. BPE, base peak electropherogram; EIE, extracted ion electropherogram; PSA, prostate‐specific antigen [Color figure can be viewed at wileyonlinelibrary.com]