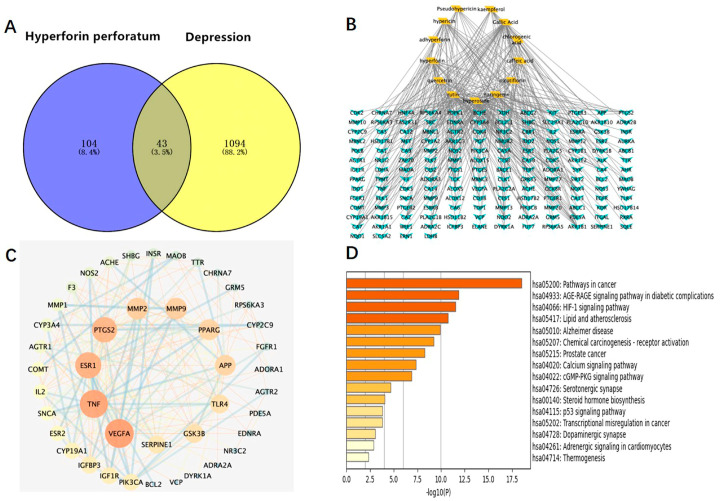
Figure 3.
Network pharmacology map of the major active components of HP and depression. (A) Venn diagram of related targets of HP and depression. (B) The active components of HP and their corresponding anti-depression targets were imported into Cytoscape software to construct the network diagram of the target of the active component. (C) PPI network of overlapping targets between drug and disease; the size of the circle represents the target degree. (D) KEGG pathway analysis of intersection targets between the main components of HP and depression.

