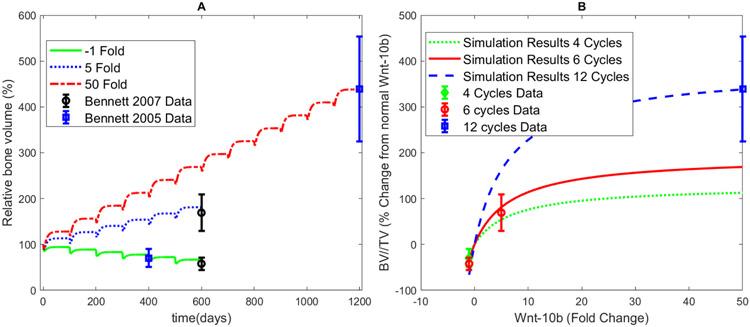
FIGURE 2.
Fitting and simulation results of bone volume and Wnt-10b. A) Fitting results for three normalized Wnt-10b fold changes shown in the legend. These specific fold changes were used to parameterize the model by comparison of the final bone volume with the corresponding data points for the Bennett 2005 data17 and the Bennett 2007 data16. B) Simulated normalized BV/TV relationship with normalized Wnt-10b fold change. The parameter fitting simulation results produce an acceptable visual fit when compared to the error. Data points were compared with the cumulative final simulated BV/TV after four remodeling cycles (green dotted curve), six remodeling cycles (red solid curve), or twelve remodeling cycles (blue dashed curve). Fold changes of Wnt-10b range from −1 to 50 in this simulation. Note that the data used in A and B is the same but represented on different axes.

