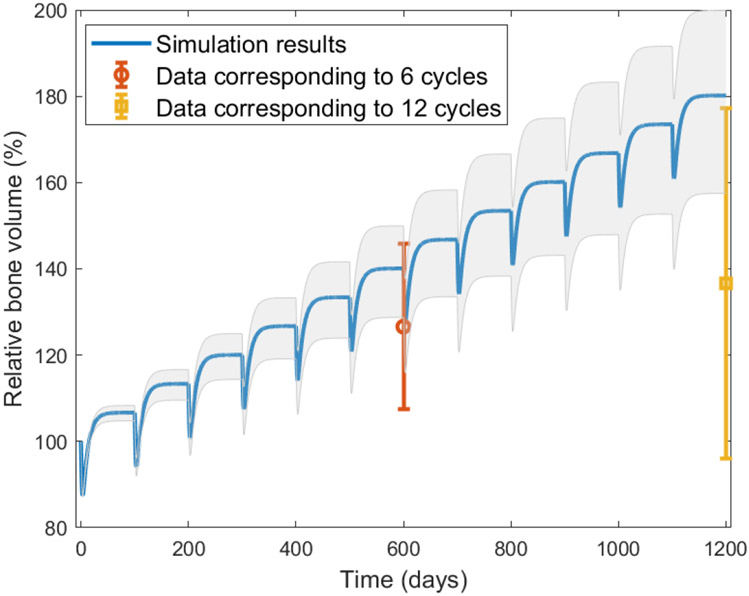
FIGURE 3.
Validation of model with data from Roser-Page et al.18. The simulation shown is the result of running the model with a 1.8 normalized fold change of Wnt-10b for twelve remodeling cycles. The grey shaded area shows the simulation results for the standard deviation (± 0.6) of the reported Wnt-10b fold change. The data18 corresponds to six and twelve remodeling cycles. The simulation falls within the error of the data for six remodeling cycles, but overestimates for twelve remodeling cycles.

