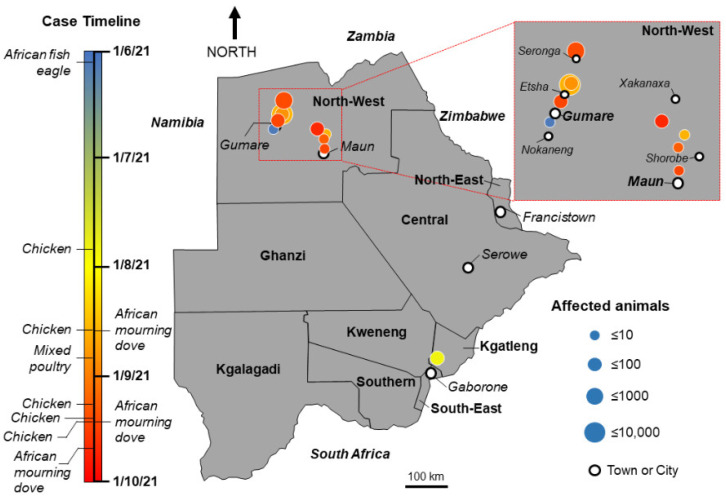
Figure 1.
Samples submitted for diagnostic assessment and geographical distribution of domestic and wild bird carcasses including timeline of detection. The distribution of observed deaths is shown on the map. Cases are coloured according to time of observation as denoted in the key. The size of circle is proportional to the number of cases with larger circles denoting a greater number of observed mortalities as per the key. Positive cases are also noted.

