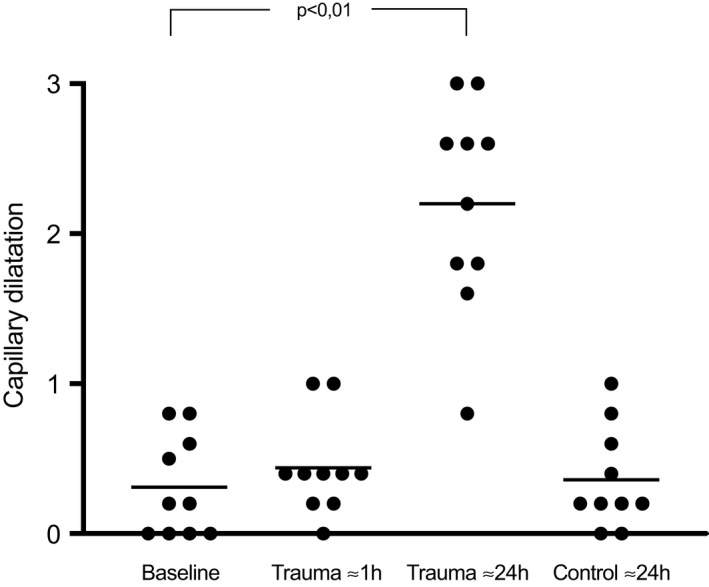
FIGURE 3.

A scatter plot of study subjects showing capillary dilatation at baseline, ≈1 h, and ≈24 h after the trauma, at 0–1 mm distance as well as the control site at 30 mm from the trauma line. Each dot represents the average of 5 recordings of each study subject. The horizontal lines are the mean values
