
Figure 2.
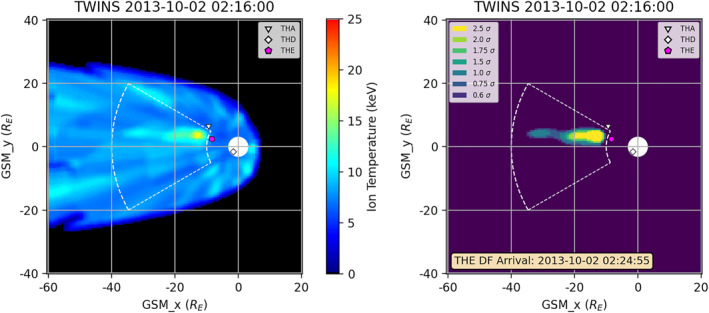
(left) Ion temperature map derived from Two Wide‐angle Imaging Neutral‐atom Spectrometers for 2 October 2013 at 02:16 UT. (right) Z‐score map of identified region. Same format as Figure 1. Locations of THEMIS satellites shown by symbols, with magenta indicating the satellite that measured the dipolarizing flux bundle (DFB). A DFB arrival was measured by THEMIS E at 02:24:55 UT as indicated in the right panel.