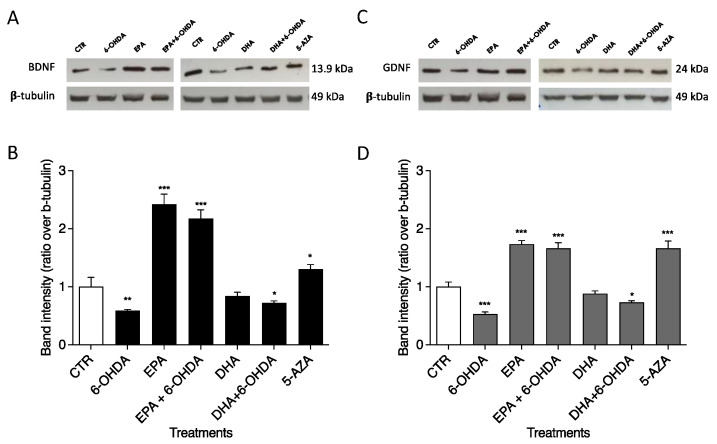
Figure 4.
Effects of EPA and DHA alone and in combination with 6-OHDA on protein expression in SH-SY5Y cells. Cells were cultured and treated as reported in M&M. BDNF (A) and GDNF (C) levels were analyzed by Western blotting. The positions of proteins are indicated in relation to the positions of molecular size standards. β-Tubulin III (neuronal) was used to normalize protein levels. Area density was evaluated by Chemidoc Imagequant TL software. Values of BDNF (B) and GDNF (D) are expressed relative to the control, which was set to an arbitrary value (1.0). Experimental samples are reported as the mean ± SD. Data from three independent experiments using four independent cultures per condition were analyzed by ANOVA using Graphpad Prism software. * p < 0.01, ** p < 0.001, and *** p < 0.0001.

