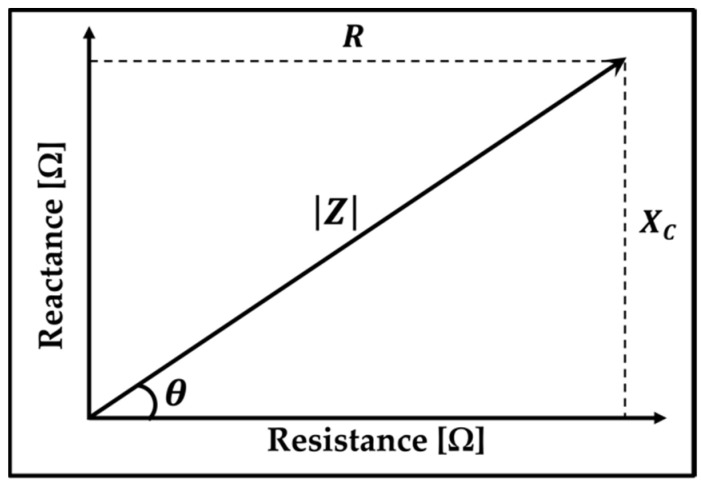
Figure 1.
Graph illustrating the impedance vector, where the resistance component’s (R) amplitude is shown by a vector on the x-axis, and capacitive reactance () is on the y-axis. A vector from zero to a point that represents both and on the x-axis and y-axis, respectively, shows the impedance amplitude.

