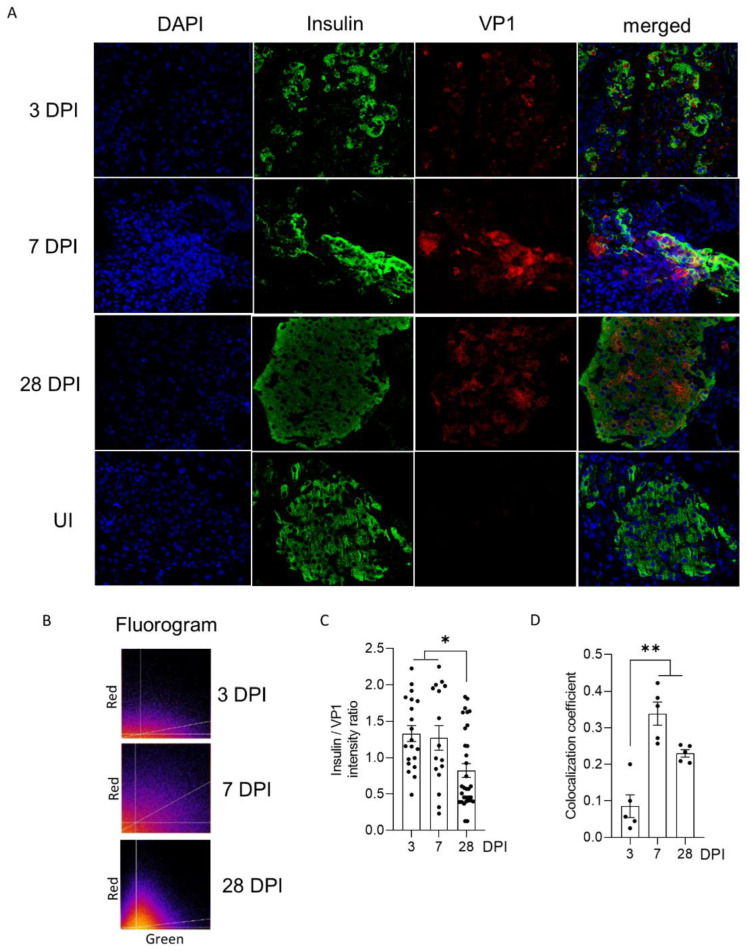
Figure 3.
Impact of CVB3/28 infection on the insulin content of pancreatic islet cells of DBA/2J mice. (A) An immunofluorescence assay was performed using monoclonal antibody for CVB3/28 VP1 and insulin in thin sections of the pancreas, from 3 to 28 days post-infection (DPI), and from uninfected mice (original magnification: ×200). (B) On the fluorograms, green intensities are plotted on the x-axis, and red intensities are plotted on the y-axis. The white lines in both plots represent threshold levels applied to both channels for subsequent analysis of the volume. The third line represents a correlation curve using colocalization analyses with JACop. All pixels above and on the right are possible colocalized points. (C) Insulin/VP1 intensity ratio was measured for cells positive for insulin from 3, 7 and 28 DPI (n= 20, 16 and 32 regions of interest (ROIs) respectively). (D) Colocalization coefficient (Pearson) was calculated using QuPath from 3 to 28 DPI in 1 to 3 islets per slice (n = 5, each dot represents an islet), from 3 to 28 DPI. The results shown are representative of 3 mice at each indicated time point. ROIs (were chosen within the positive cells for insulin, and colocalization was monitored with the JACoP plugin of ImageJ (manual thresholding). Data represent mean +/− SEM. Mann-Whitney Test. *: p < 0.05; **: p < 0.01. VP1: viral protein 1. UI: uninfected. DPI: days post-infection.

