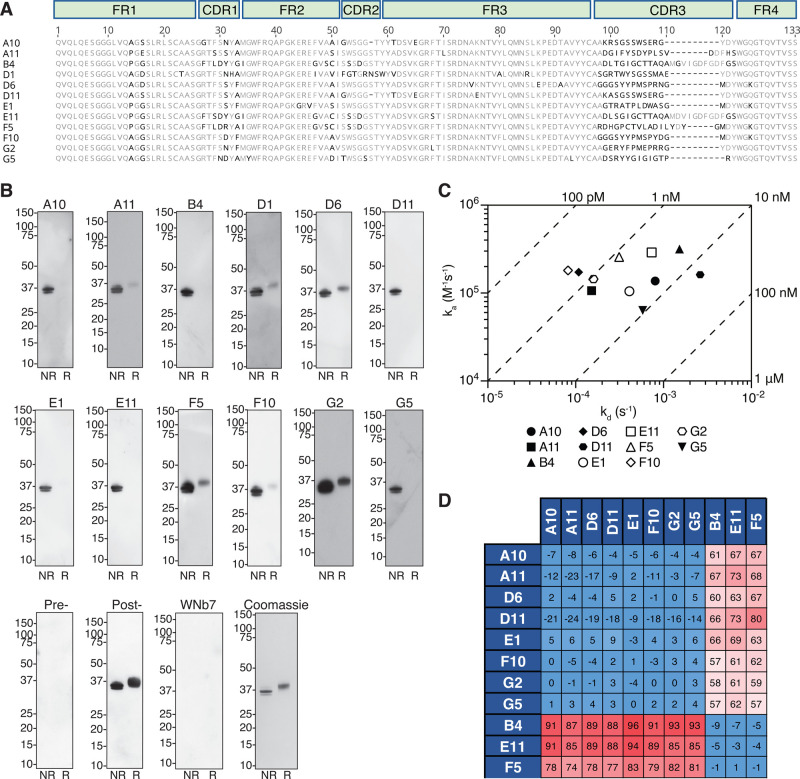
Figure 2. Pfs230 specific nanobodies.
(A) Amino acid sequence alignment of 12 Pfs230 nanobodies with framework regions (FR) and complementary-determining regions (CDR) indicated. (B) Detection of recombinant Pfs230 D1D2 by nanobodies using Western blotting. Non-reduced (NR) and reduced (R) Pfs230 D1D2 protein was separated by SDS–PAGE and probed with the respective nanobodies (top and middle row), pre- and post-immunization alpaca sera, or a SARS-CoV-2 nanobody WNb7 (bottom row). An HRP-conjugated goat anti-llama IgG was used for detection. Molecular mass marker (M) in kDa is shown on the left-hand side. A Coomassie-stained SDS–PAGE gel is used as a loading control (bottom row, right hand-side). (C) Iso-affinity plot showing the dissociation rate constants (kd) and association rate constants (ka) of nanobody binding to Pfs230 D1D2 as measured by BLI. Data points are the average of two independent experiments. Diagonal lines indicate equilibrium dissociation rate constants (KD). (D) Epitope competition experiments with immobilized nanobodies indicated on the left column incubated with nanobodies indicated on the top row pre-incubated with Pfs230 D1D2 using a 10 : 1 molar ratio. Percentage binding of Pfs230 D1D2 pre-incubated with nanobody was calculated relative to Pfs230 D1D2 binding alone, which was assigned to 100%. The red and blue boxes represent non-competing and competing nanobodies, respectively.

