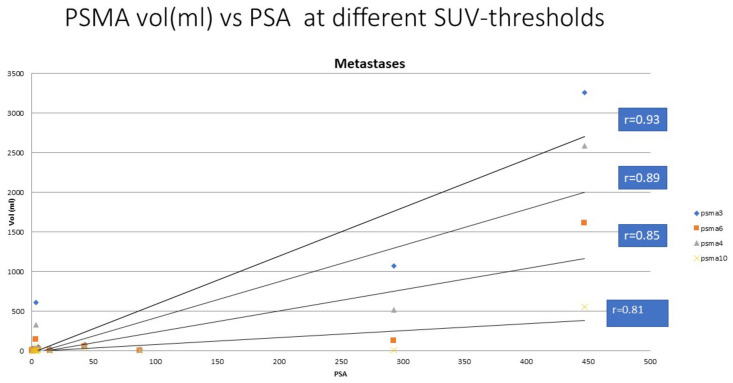
Figure 1.
The serum PSA concentration vs. pathologic PSMA volume on 68Ga-PSMA PET using thresholds of 3.0, 4.0, 6.0, and 10.0 for SUVPSMA. The threshold value 3.0 gave the best correlation (R = 0.93), whereas the correlation coefficients were slightly weaker for threshold values of 4.0, 6.0, and 10.0, i.e., r = 0.89, 0.85, and 0.81, respectively.

