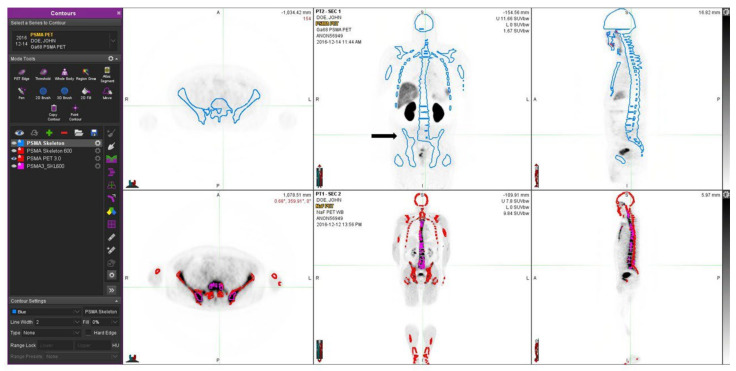
Figure 3.
A 66-year-old patient with newly diagnosed prostate cancer and T3bN0M0 with a GS 7 is shown. He was treated with volumetric targeted radiotherapy (VMAT) and androgen deprivation. In the upper row, Ga-PSMA shows some local activity in the prostate, which is under current targeted treatment; no skeletal disease is seen. The blue contours demonstrate the thresholds based on HU > 150 on the CT component of the CT component in the PET/CT study. In the lower row, from the NaF PET study, the contours of the skeleton (HU > 150) are shown in red, and regions of sclerosis (HU > 600) are shown with purple contours. These corresponded with dense sclerotic regions on CT and were not associated with skeletal metastases. At the time of the imaging, the S-PSA was 17.1 (patient II).

