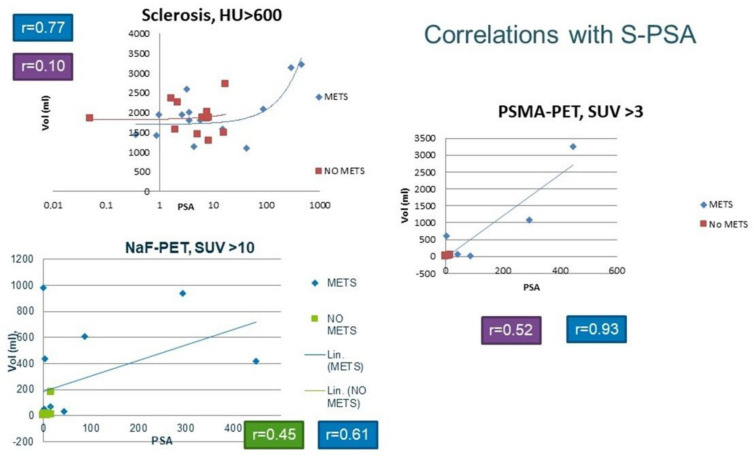
Figure 6.
The graphs demonstrate the correlations between the total pathological PSMA volume in PET and S-PSA (on the right) and between the total pathological NaF volume in PET and S-PSA (lower left panel). In the upper left graph, the correlation between the total sclerosis volume for CT and S-PSA is shown on a logarithmic scale because of the high range of the numbers. The correlation between PSMA volume and S-PSA was strong in those patients with skeletal metastases (group M) (r = 0.93, n = 14), whereas, in patients with no bone metastases (group N), there was no correlation (r = 0.52, n = 12). The correlation was much weaker between the total pathological NaF volume in PET and S-PSA (r = 0.61, n = 14) in group M, and there was no correlation in group N (r = 0.45, n = 12). Sclerosis did not correlate with S-PSA in those patients with no bone metastases (r = 0.10, n = 12). However, there was a moderate correlation between the total sclerosis volume for CT and S-PSA (r = 0.77, n = 14) in group M.

