Figure 5.
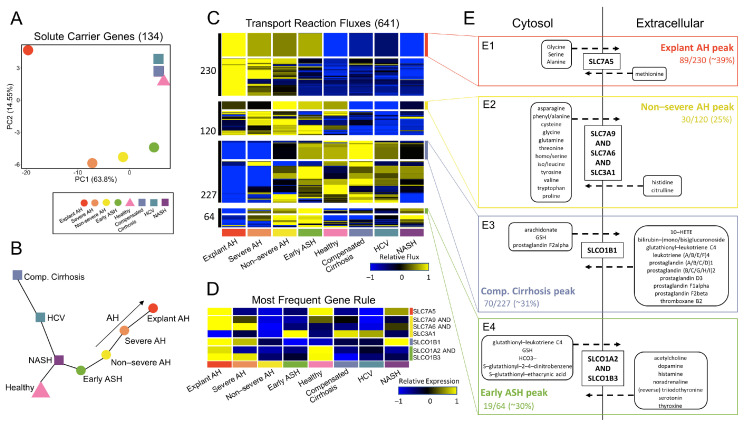
Regulatory and functional activity of solute transporters. (A) PCA plot for the 134 solute carrier (SLC) genes. (B) MST plot for the SLC genes. (C) Hierarchical clustering of fluxes from the transport reaction subsystem reveals four clusters. For each cluster, the gene rule associated with each reaction was identified. The reactions with the most frequent gene rule are annotated for each cluster. (D) The associated gene expression for each of the most frequent gene rules in (C) is shown. (E) A metabolic pathway map for each of the clusters with associated most frequent gene rule is shown. (E1) shows sequentially increasing flux behavior with AH severity, peaking at explant AH, for reactions with gene rule SLC7A5. (E2) shows increasing flux activity from healthy to non-severe AH, at which the fluxes peak, for reactions with gene rule SLC7A9 and SLC7A6 and SLC3A1. (E3) shows fluxes peaking at compensated cirrhosis for reactions with gene rule SLCO1B1. (E4) shows sequentially increasing flux behavior with decreasing AH severity, peaking at early ASH, for reactions with gene rule SLCO1A2 and SLCO1B3.

