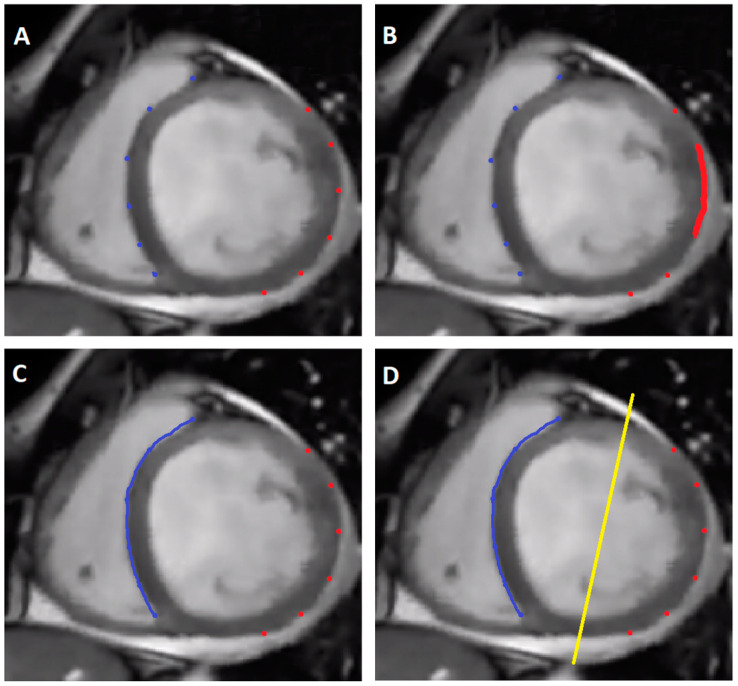
Figure 3.
Schematic presentation of HOT-CRT concept vs. standard CRT. (Panel (A)): blue dots–RV pacing sites, red dots–LV pacing sites in CRT. To achieve optimal resynchronization the anatomic location of RV and LV leads should be exactly opposite which is not achievable for each patient. (Panel (B)): the red-marked area on the left ventricle indicates the most successful resynchronization LV electrode placement site. If the given patient does not have an appropriate target vein in this region the procedure result will not be optimal. (Panel (C)): In HOT-CRT concept the blue line represents RV activation area originating from His Bundle pacing via right bundle branch. (Panel (D)): Optimal resynchronization results from achieving perfect fusion of activation fronts coming from right and left site, as depicted by the yellow line. This effect is much more probable in HOT-CRT approach.

