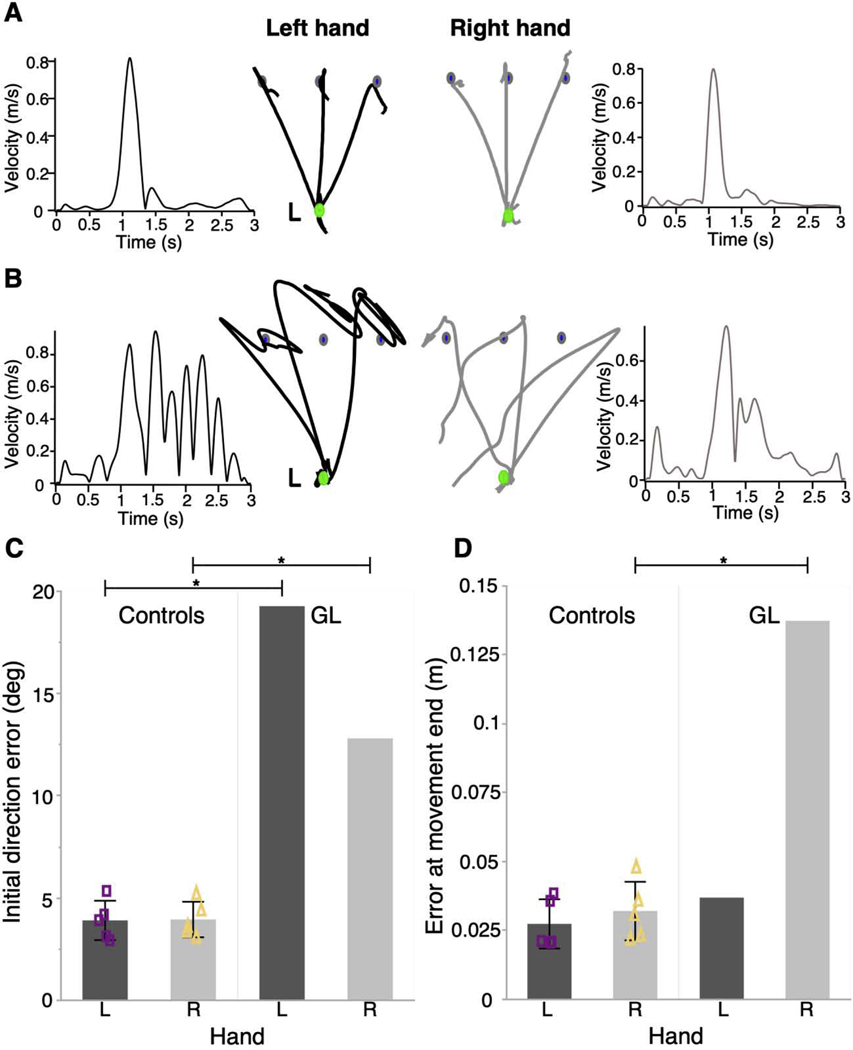
Figure 3.
Deafferentation reveals differential deficits in the control of arm movement and posture in the two limbs. Participants performed reaching movements to a target (blue) placed in one of three directions from an initial start position (green). Vision of hand path was removed upon leaving the start position. Left and right hand paths and tangential velocity profiles are shown for A) a representative control individual and B) a deafferented individual. Scale bars next to the left hand trajectories represent 2 cm hand movement. C) Mean initial direction error and D) mean error at movement’s end is displayed for each hand of 5 control participants and the deafferented individual. Error bars in control data represent 1 standard deviation from the mean. Mean values for each control participant are plotted as purple squares (left hand) or yellow triangles (right hand). p < 0.001 (*). Reprinted with permission from [38].

