Figure 5.
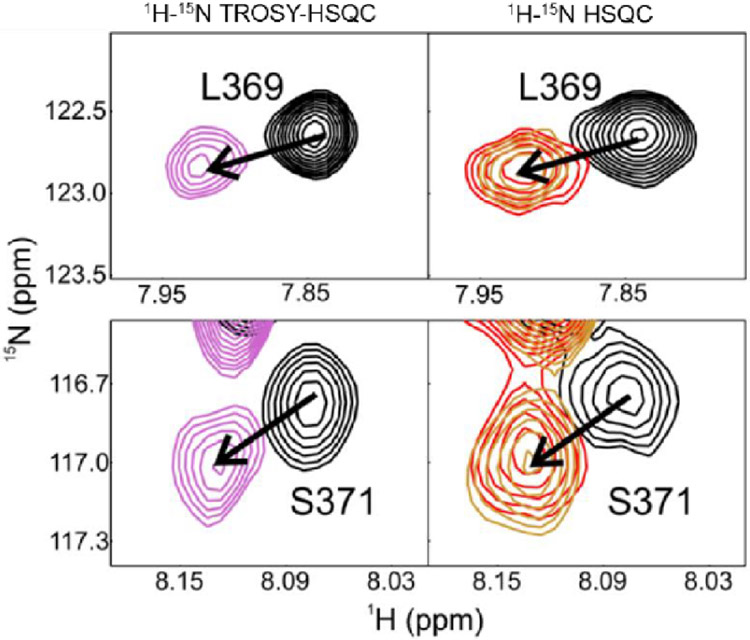
Selected regions of 1H-15N TROSY-HSQC (left) and 1H-15N HSQC (right) spectra of full-length 15N(304-393)-p53 free (black) and bound to a 60-bp DNA with random nucleotide overhangs (violet, DNA-L sequence), with (ATG)n repeat overhangs (red) and with p21-native sequence overhangs (gold). Differences in cross-peak lineshapes between the left and right spectra are due to differences in experimental setup (TROSY vs non-TROSY) and different isotopic labeling schemes (2H labeling in TROSY-HSQC, 1H in HSQC). Spectra were recorded in NMR buffer (containing 150 mM NaCl) at 25°C, and all samples used a protein-DNA ratio of 4:1.

