
Figure 1.
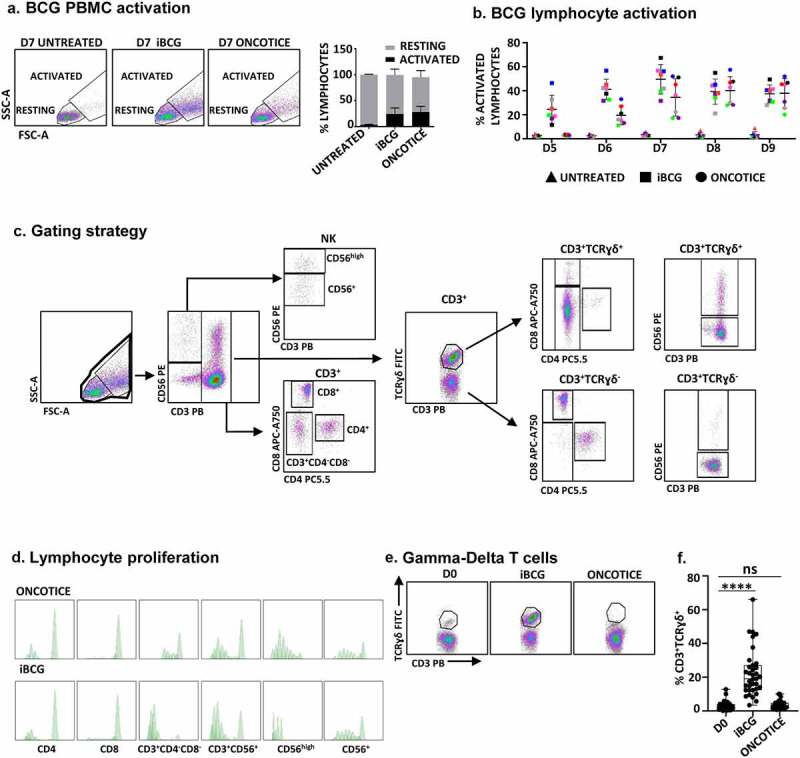
Incubation with iBCG leads to expansion of γδ T-cells.
PBMC from healthy donors were incubated with the sub-strains of BCG iBCG or Oncotice at a 6:1 ratio (total bacteria to PBMC). At the indicated days of culture, cells in suspension were recovered from the co-culture and analyzed by flow cytometry. a. Lymphocyte activation. The percentage of lymphocyte activation was determined at day 7 by identifying the resting and activating lymphocyte regions by FSC vs SSC (left panels). For activation markers see Supplementary Figure 1. The percentage of activated lymphocytes and standard deviation, from 16 independent donors, is plotted in the right panel. b. Time course of lymphocyte activation. PBMC were analyzed after five to 9 days in co-culture with BCG. c. Gating strategy for lymphocyte phenotyping. Once the dead cells were eliminated, NK cells were selected within the whole lymphocyte population in a CD3 vs CD56 plot. Activated CD56high NK cells were gated separately from the rest of CD3−CD56+ NK cells. The CD3+ region was further analyzed for the expression of the γδ TCR and within each subset, CD4, CD8, and CD56. In some experiments, CD4 and CD8 expression was directly tested in the CD3+ region. d. Lymphocyte proliferation. PBMC were stained with CellTraceTM Violet before the incubation with BCG, and proliferation was analyzed evaluating the amount of dye per cell by flow cytometry in the different populations. e. Expression of γδ T-cells in PBMC from a representative donor. The γδ T-cell population is shown within CD3+ cells. f. Expansion of CD3+ γδ T-cells in PBMC. N = 35 experiments with 33 donors. Statistical analysis was done by one-way ANOVA.