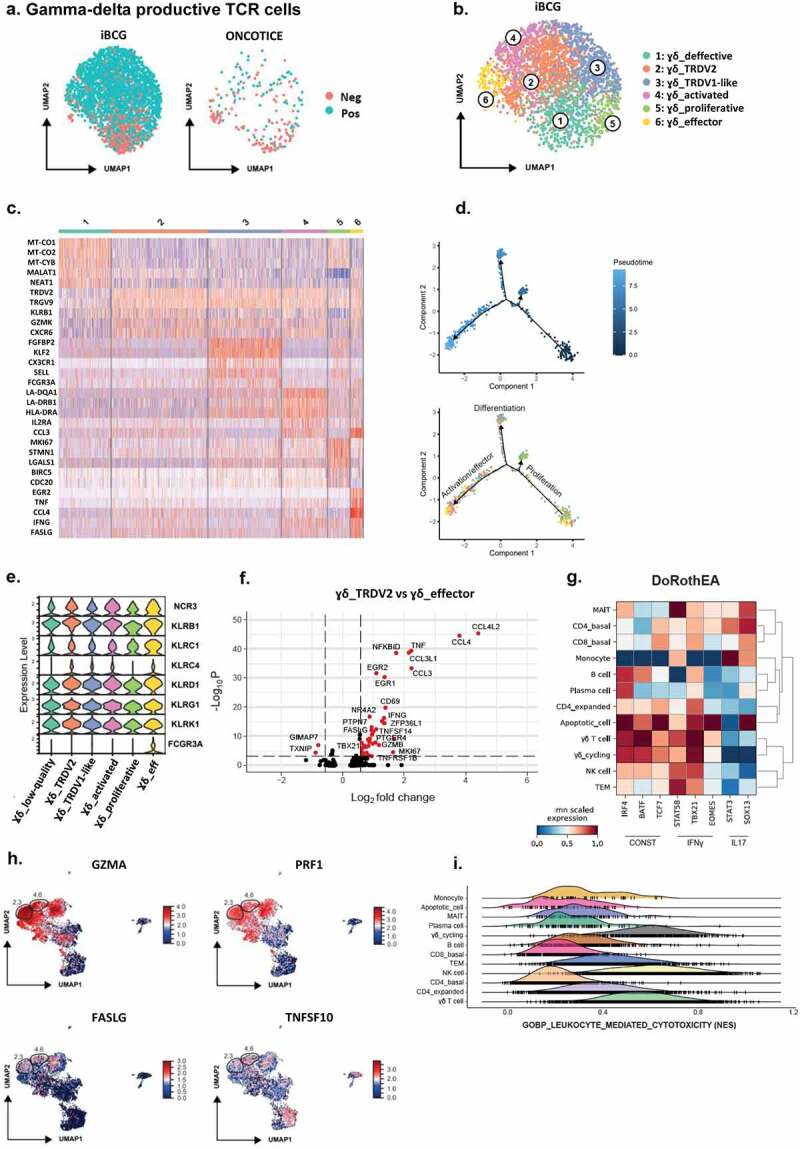
Figure 3.

scRNA-seq analysis of γδ T-cells with a productive TCR chain and their putative functional capacities.
a. γδ T-cell clusters. After cluster analysis from Figure 2, γδ T-cells expressing a productive rearranged TCR chain were further analyzed. UMAP plots represent γδ T-cells with negative (neg) vs positive (pos) expression of TRDV2/TRGV9 (TCR rearranged chains γ9δ2), in cultures treated with either iBCG or Oncotice, as indicated. b. Cluster annotation. UMAP represents the six subclusters identified within iBCG-treated cultures. Subcluster annotation was performed using FindClusters and FindMarkers as described in Methods. The subcluster labels were added manually. c. Heat-map. Heat-map represents the scaled expression of differentially expressed genes across the γδ T-cell subclusters defined in a and b. d. Trajectory analysis for γδ T-cell subclusters. One hundred cells were used per subcluster to perform a trajectory analysis (Monocle2). Cells were represented in a two-dimensional independent space and were colored by pseudotime or by subcluster identity. e. NK receptors expressed by γδ T-cell subclusters. Stacked violin plots represent the mean scaled expression of markers per subcluster. f. Differential expression of genes between the γδ_TRDV2 and γδ_effector subclusters. Volcano plot represents the genes differentially expressed between the γδ_TRDV2 and the γδ_effector subclusters, highlighting in red genes with a Log2FC > 0.58 and a Bonferroni adjusted p-value < 10−4. g. Transcription factor inference. Matrix plot shows the mean standardized transcription factor activity (x-axis) inferred per original cluster (y-axis). h. Expression of molecules involved in cytotoxicity. UMAP represents the expression of granzyme A (GZMA), perforin 1 (PRF1), Fas-ligand (FASLG), and TRAIL (TNSF10) within the entire dataset. Relative localization of γδ T-cell subclusters 2, 3, 4 and 6 is highlighted. i. Comparison of the cytotoxic capacity. Ridge plot represents the normalized enrichment scores (NES) per cluster for the “GOBP_leukocyte_mediated_cytotoxicity” signature.
