
Figure 5.
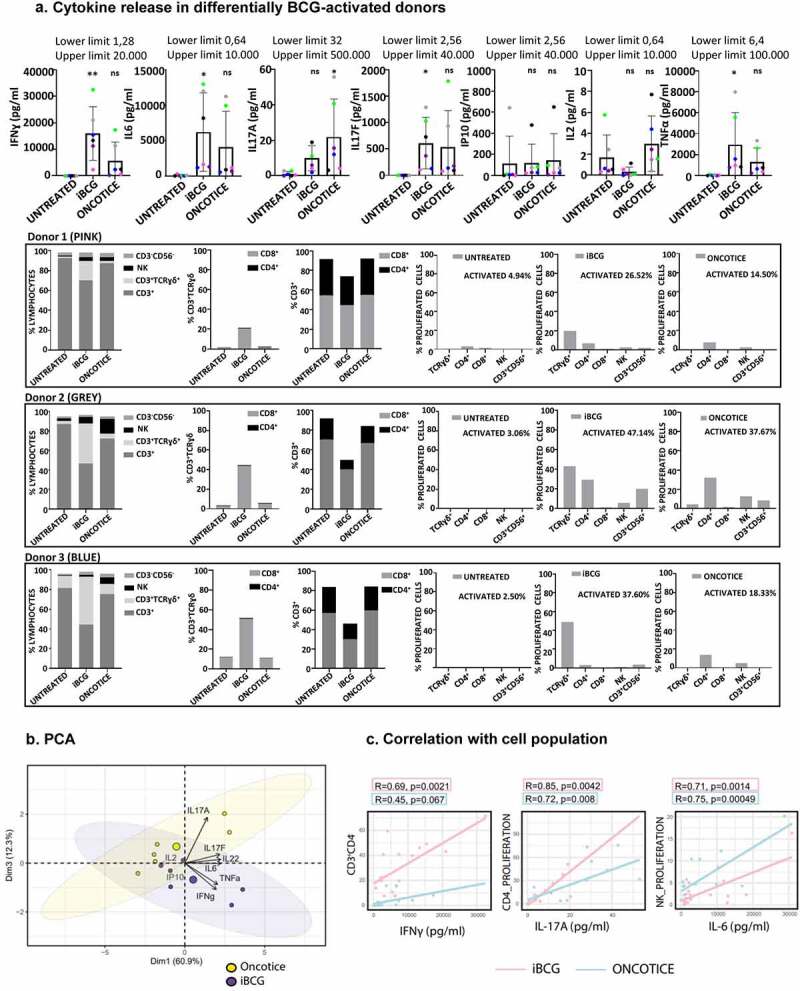
Cytokines released to PBMC cultures after 7-day exposure to BCG.
a. Luminex analysis. PBMC from six healthy donors were incubated with iBCG or Oncotice as indicated. After 7 days in culture, cell supernatants were recovered for luminex analysis and cells were analyzed by flow cytometry. Cytokine concentrations and standard deviations are depicted in the upper row. Statistical analysis of each treatment with the untreated condition was done by one-way ANOVA. For comparison, flow cytometry data indicating activation and proliferation in the culture from three representative donors (high vs low activation levels) are represented in the three bottom rows: graphs show the percentage of lymphocyte populations obtained at day 7 for each treatment, the percentage of γδ T-cells, CD3+ excluding γδ, and the percentage of populations that proliferated with each treatment (measured by CellTraceTM Violet staining), as indicated. b. PCA biplot. Representation of the loadings of principal components. iBCG and Oncotice-treated PBMC were included as separate variables. c. Correlation of cytokine production and cell population proliferation. Scatter plot representing the Pearson correlation between parameters (cytokine concentration and cell population that proliferated as measured by CellTraceTM Violet staining). Pink: iBCG; Blue: Oncotice. R and P values were obtained in R using the ggpubr package.