
Figure 7.
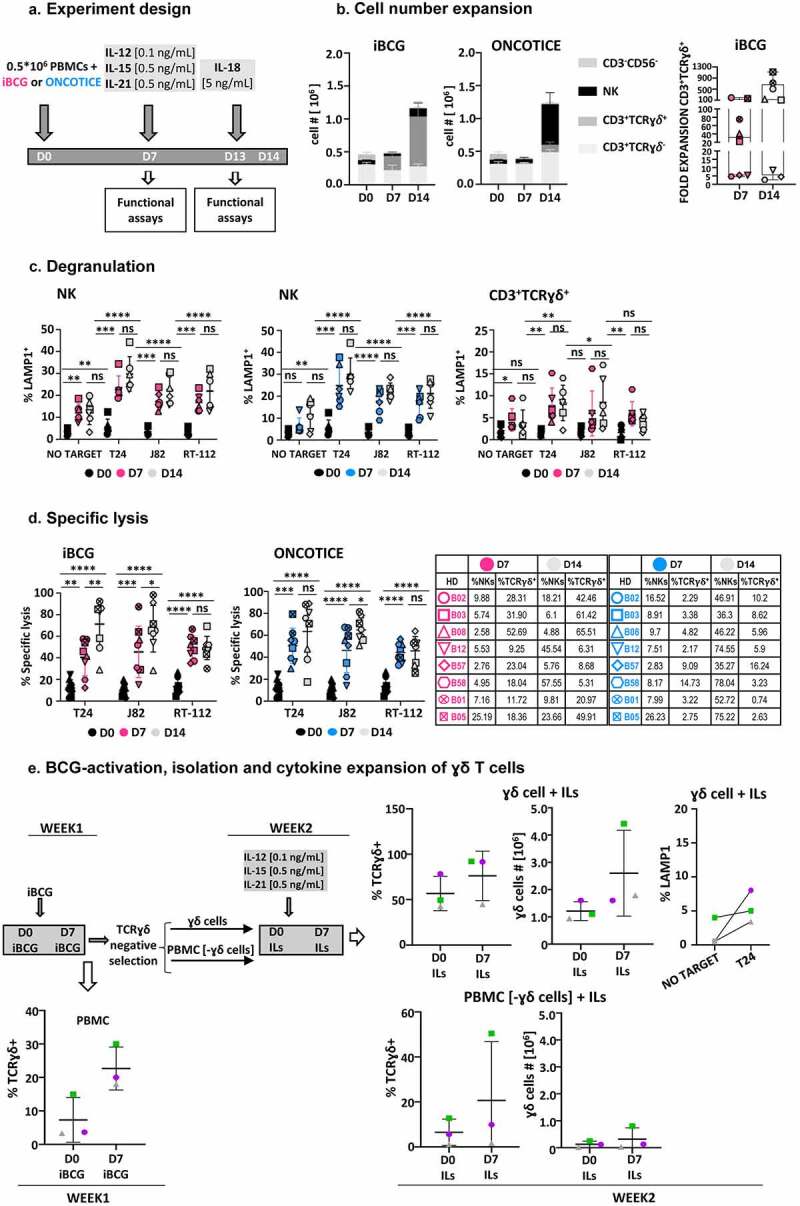
In vitro expansion and isolation of innate effector cells by BCG exposure followed by cytokine treatment. a. Cytokine culture experiment design. PBMC from eight healthy donors were incubated with iBCG (pink) or Oncotice (blue). After 7 days in culture, cells were stimulated with a combination of minimal doses of IL12 (0.1 ng/ml), IL15 (0.5 ng/ml), IL21 (0.5 ng/ml) (gray). One day before analyses, low-dose IL18 (5 ng/ml) was added. b. Cell numbers. At the end of the incubation time, cells were counted and the percentage of each population within the live cell gate was analyzed by flow cytometry (left panel). The fold- expansion of CD3+ γδ T-cells after 7 and 14 days is shown (right panel). Each symbol represents a different healthy donor (HD) c. Degranulation. PBMC from 6 healthy donors were used as effector against target cells (the bladder cancer cell lines T24, J82, RT-112; K562 cells were used as NK positive control target), as indicated. The functional capacity of NK cells and γδ T-cells were analyzed separately (in Oncotice-treated cells the latter population was scarce, so its analysis is not shown). 12500 effector cells (normalizing for NK cells) were incubated with 25000 target cells (1:2 E:T ratio) and surface LAMP-1 (CD107a) was measured. Pink: iBCG; Blue: Oncotice; Grey: minimal dose cytokines, target as indicated. Statistical analysis was done by one-way ANOVA. d. Specific cytotoxicity. Effector cells were included in cytotoxicity assays against target cells labeled with calcein-AM. 50000 effector cells (normalizing for NK cells) were incubated with 10000 target cells (5:1 E:T ratio). Pink: iBCG; Blue: Oncotice; Grey: minimal-dose cytokines. Statistical analysis was done by one-way ANOVA. e. BCG-activation, purification and minimal-dose cytokine expansion of γδ T-cells followed by degranulation experiments. PBMC from three healthy donors were incubated with iBCG. After 7 days in culture, γδ T-cells were subjected to selection using the MACS system and 106 cells were stimulated with a combination of low-dose IL12 (0.1 ng/ml), IL15 (0.5 ng/ml), IL21 (0.5 ng/ml) and kept in culture for another week and analyzed, then, by flow cytometry. Data from three healthy donors, each one depicted with a different symbol, are shown. Because purity of the γδ T-cell selection decreased after BCG-activation, compared to the 95% purity obtained when using fresh cells, the γδ T-cell number before (D0) and after iBCG culture (D7), as well as those obtained after selection and cytokine activation are depicted separately. The average and standard deviation are shown in each graph. γδ T-cells (average 75% purity), obtained after BCG-activation and further expansion with low-dose cytokines, were used as effector cells in degranulation assays. The graph represents the percentage of LAMP-1 (CD107a) measured by flow cytometry.