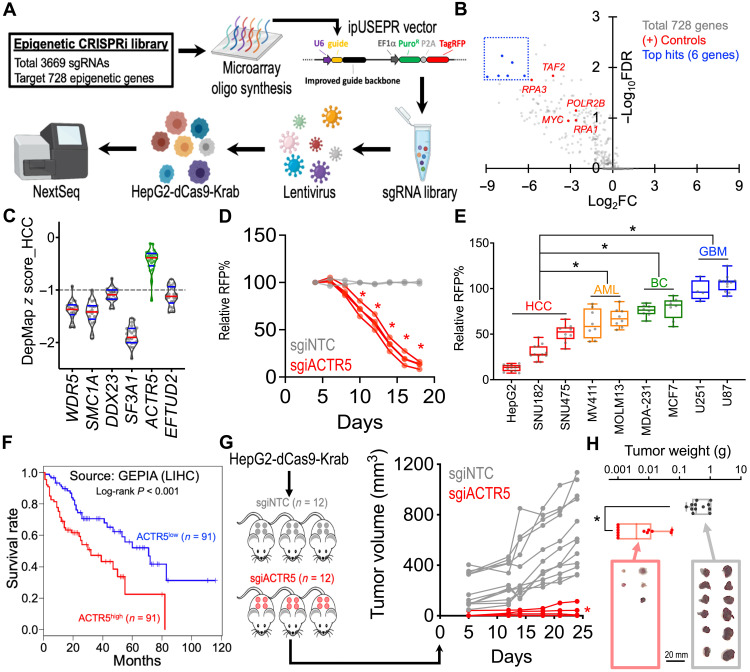
Fig. 1. CRISPRi screen identifies the essential role of ACTR5 in HCC.
(A) Schematic outline of an epigenetic-focused CRISPRi screen in HepG2-dCas9-Krab cells. (B) Volcano plot depicts the change of sgRNA abundance [x axis; log2 (fold change)] and significance [y axis; −log10 (false discovery rate)] of each gene during the 24-day epigenetics CRISPRi screen. (C) Violin plot indicates the median (red lines) and quartiles (blue lines) of the gene dependency score (z score) over 22 HCC cell lines (dots) in the DepMap genome-wide CRISPR screen 20Q2 database. (D) Growth competition assay of HepG2-dCas9-Krab cells transduced with RFP-labeled nontargeting control (gray lines; n = 2 independent sgiNTC sequences) and ACTR5-targeting sgiRNAs (red lines; n = 4 independent sgiACTR5 sequences). (E) Box-whiskers plot of the growth competition assay in nine Cas9-expressing cancer cell models transduced with sgACTR5 (dots; n = 4 independent sgACTR5 sequences). (F) Survival curves of liver HCC patients with high versus low ACTR5 expression. Source: GEPIA database (http://gepia.cancer-pku.cn). (G) Profile plot of tumor volume (in cubic millimeters) and (H) box-whiskers plot of tumor weight (in grams) of the HCC xenograft tumors in NSG mice inoculated with sgiNTC and sgiACTR5-transduced HepG2-dCas9-Krab cells (n = 12 tumor sites per group). Box-whiskers indicate the first and third quartiles (boxes) and the range (whiskers). *P < 0.01 by two-sided Student’s t test.

