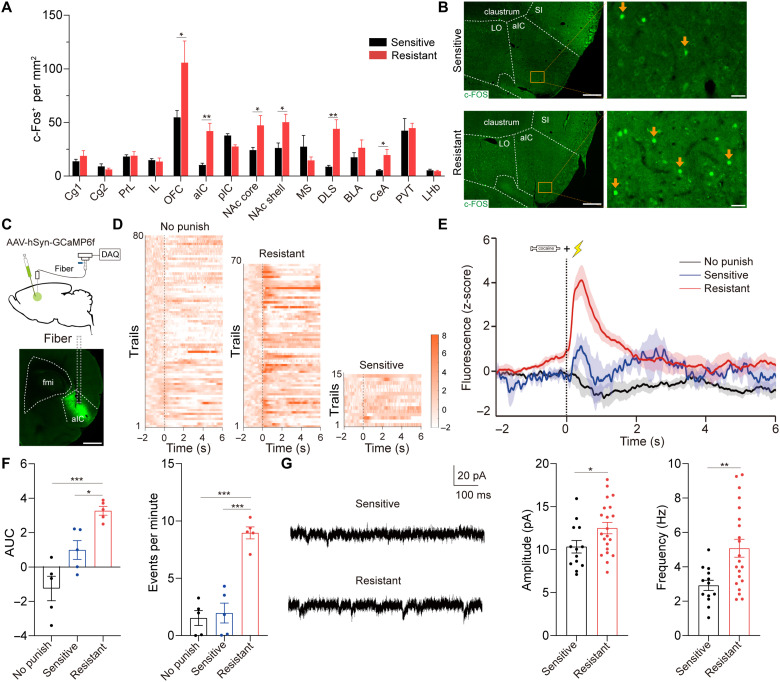
Fig. 2. Hyperactive aIC neurons in shock-resistant rats.
(A) Mapping of c-Fos across brain regions 90 min after the third punishment test. Unpaired t test, t11 = 2.24, *P = 0.046 for OFC; t10 = 4.21, **P = 0.005 for aIC; t12 = 2.50, *P = 0.039 for NAc core; t12 = 2.53, *P = 0.027 for NAc shell; t12 = 4.13, **P = 0.004 for DLS; t12 = 2.71, *P = 0.03 for CeA; n = 5 to 6 and 7 to 8, respectively. (B) Representative images of c-Fos immunofluorescence staining of aIC. Scale bars, 500 μm (left) and 50 μm (right). (C) Schematic of calcium photometry. Scale bar, 1 mm. (D and E) Heatmap and plot of z-scored aIC Ca2+ signals in no punish, sensitive, and resistant group; n = 5 for each group. (F) AUC of z-scored aIC Ca2+ signals in 0 to 2 s. One-way ANOVA, F2,12 = 17.58, P < 0.001, post hoc analysis, *P = 0.028 for sensitive versus resistant, ***P < 0.001 for no punish versus resistant. Number of events per minute of aIC neurons. One-way ANOVA, F2,12 = 36.00, P < 0.001, post hoc analysis, ***P < 0.001 for sensitive versus resistant and no punish versus resistant; n = 5 for each group. (G) Amplitude and frequency of sEPSCs of aIC neurons. Unpaired t test, t32 = 2.12, *P = 0.042 and t32 = 3.60, **P = 0.001, respectively; 13 neurons from 3 sensitive rats and 21 neurons from 5 resistant rats. Cg1, cingulate cortex area 1; Cg2, cingulate cortex area 2; PrL, prelimbic cortex; IL, infralimbic cortex; NAc core/shell, nucleus accumbens core/shell; MS, medial septum; DLS, dorsolateral striatum; BLA, basolateral amygdala; CeA, central amygdala; PVT, paraventricular thalamus; LHb, lateral habenula. Data are presented as mean values ± SEMs.

