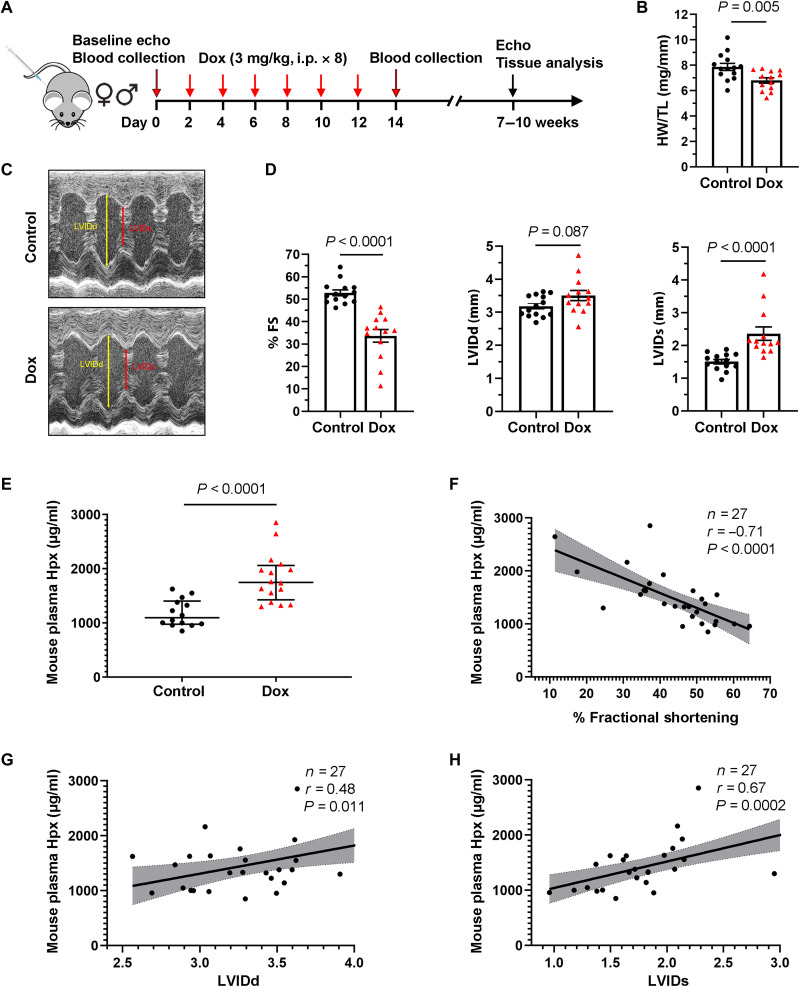
Fig. 2. Circulating Hpx is elevated in mice treated with Dox.
(A) Dox-induced chronic cardiomyopathy model in mice. i.p., intraperitoneally. (B) Heart weight (HW)/tibia length (TL) ratio in saline-treated (control) and Dox-treated (Dox) groups. (C) Representative images of control and Dox mice obtained during conscious echocardiography. (D) Cardiac function at 5 to 8 weeks after Dox treatment: FS, LVIDd, and LVIDs in control and Dox groups. FS, fractional shortening. (E) Absolute levels of mouse plasma Hpx following treatment in control and Dox groups. (F to H) Absolute levels of mouse plasma Hpx after treatment were associated with change in % FS, LVIDd, and LVIDs. Data were expressed as means ± SEM. Welch’s t test was used to compare the difference between control (n = 14) and Dox-treated (n = 13) groups. Pearson’s correlation coefficient was used in (F) to (H).

