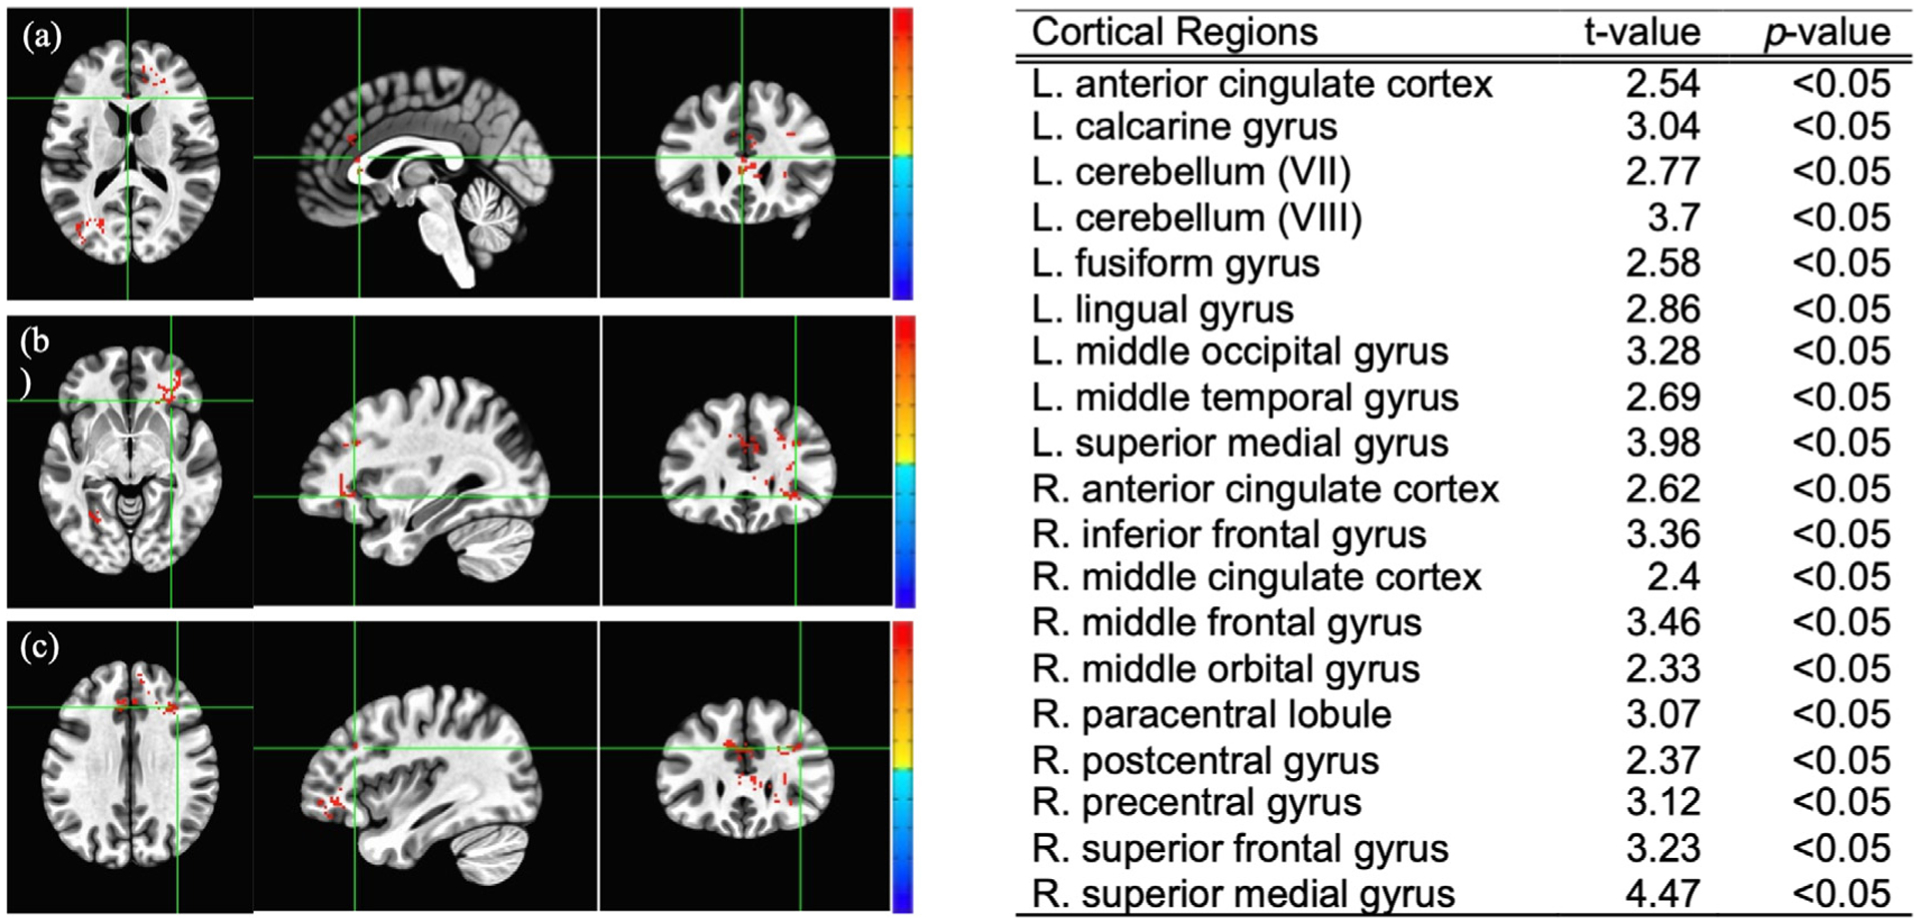
Fig. 3.

Blood-oxygen-level-dependent (BOLD) signal group analysis at baseline between the responder and non-responder group (Student’s t-test values listed on the right). Red indicates significantly higher cortical activation in the responder group at voiding initiation with a positive t-value; blue indicates significantly lower activation with a negative t-value. Some examples of cortical regions with significantly higher activation in the responder group are: (a) Left anterior cingulate cortex, (b) Right inferior frontal gyrus, (c) Right middle frontal gyrus.
