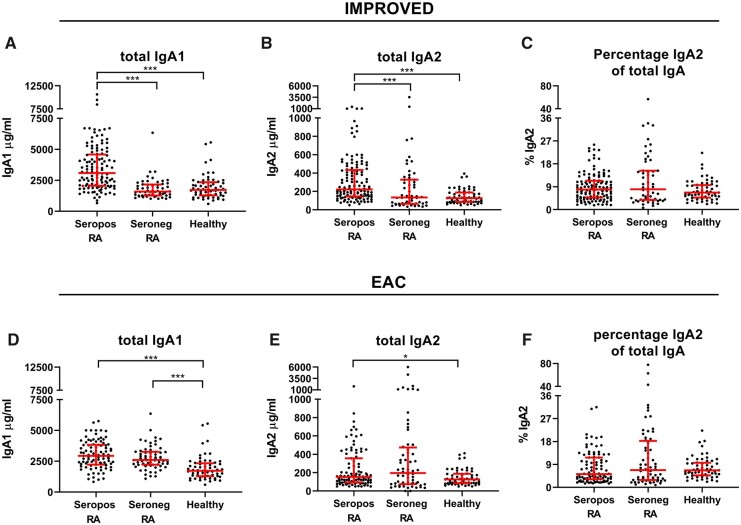
Fig. 1.
Total IgA subclasses
Total IgA1, total IgA2 and percentage IgA2 of total IgA in seropositive and seronegative RA patients compared to healthy controls. Mann–Whitney U tests to compare IgA levels between seropositive or seronegative RA patients and healthy donors. Red bars: median and interquartile range. *P < 0.05, **P < 0.01, ***P < 0.001, no brackets shown when P > 0.05. Not all samples were measured in the same experiment. Colour version available online.

