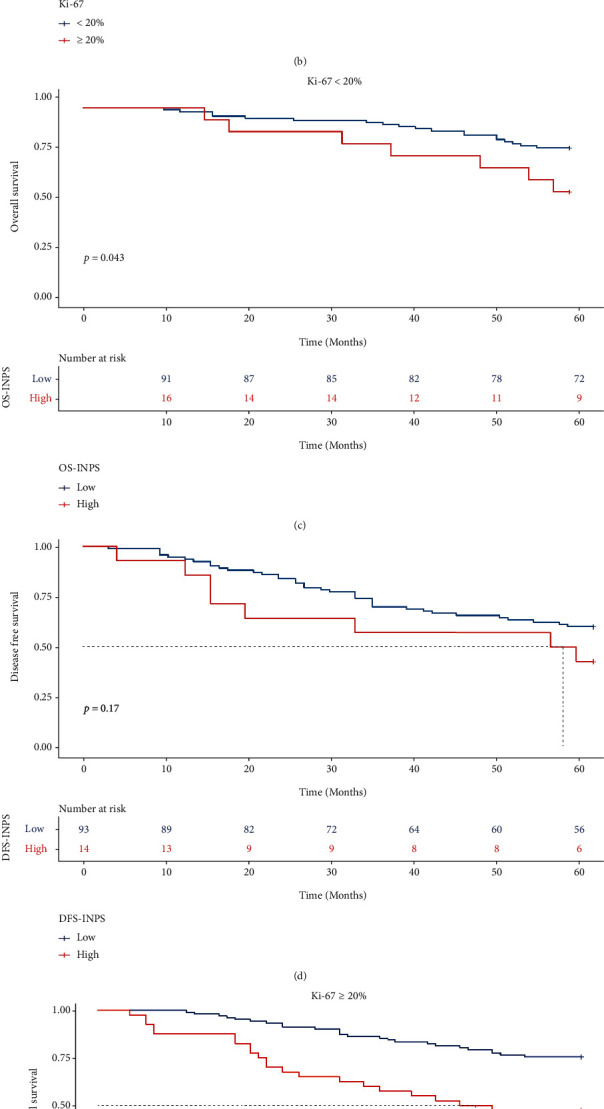
Figure 6.

Kaplan-Meier curves of different Ki-67 index breast cancer patients for OS (a) DFS (b). K-M analysis of OS (c) and DFS (d) for breast cancer patients with Ki-67<20% by INPS; K-M analysis of OS (e) and DFS (f) for breast cancer patients with Ki-67 ⩾ 20% by INPS.
