
Figure 3.
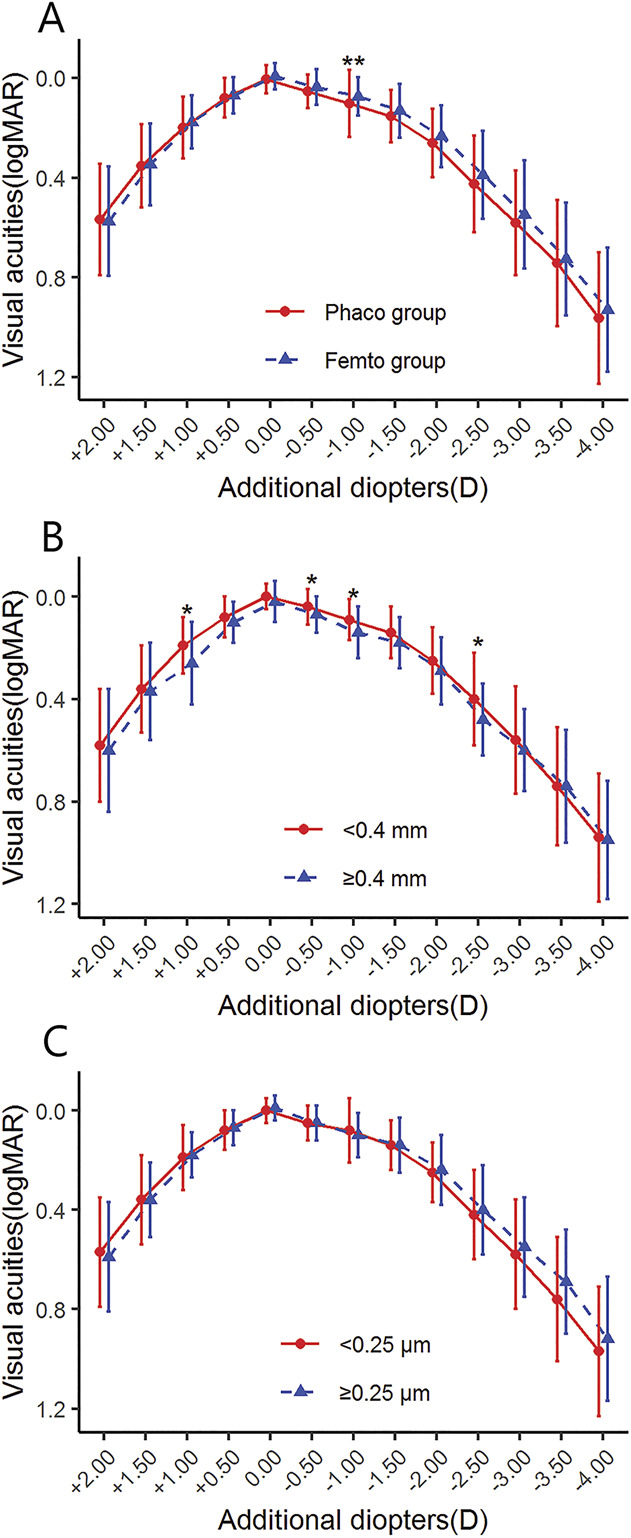
Defocus curves after IOL implantation between the Femto and the Phaco groups (A) and the groups divided separately with IOL decentration (B) or tilt (C). <0.4 mm = IOL decentration <0.40 mm; ≥0.4 mm = IOL decentration ≥0.40 mm; <0.25 μm = tilt <0.25 μm; ≥0.25 μm = tilt ≥0.25 μm. **P < .01.